

Predictive multi-imaging biomarkers relevant for visual acuity in idiopathic macular telangiectasis type 1
- PMID: 29506510
- PMCID: PMC5836363
- DOI: 10.1186/s12886-018-0737-y
Predictive multi-imaging biomarkers relevant for visual acuity in idiopathic macular telangiectasis type 1
Abstract
Background: To evaluate the structural changes associated with visual acuity (VA) in patients with idiopathic macular telangiectasia (MT) type 1 using multimodal imaging modalities.
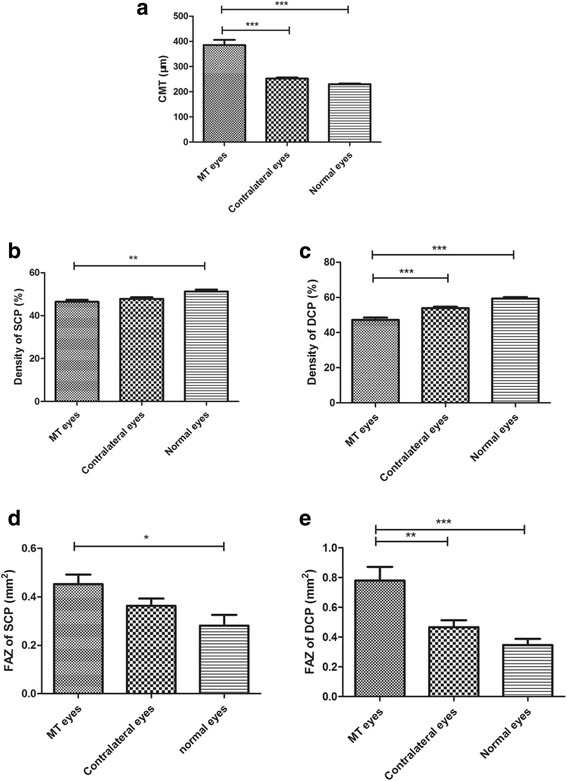
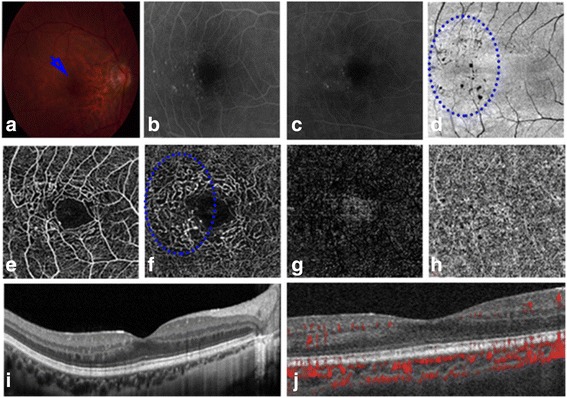
Methods: A retrospective study of 14 patients with MT type 1 and of 10 eyes from 10 healthy individuals as age-matched controls was conducted. The medical records of patients who had undergone colour fundus photography, spectral domain optical coherence tomography (OCT), fluorescein angiography and OCT angiography were reviewed. Central macular thickness (CMT), the areas of macular oedema and ellipsoid zone (EZ) disruption, EZ length, disorganization of the retinal inner layers (DRIL) and external limiting membrane (ELM) disruption, as measured by spectral domain OCT; and vascular density and the foveal avascular zones (FAZ) of the superficial capillary plexus (SCP) and deep capillary plexus (DCP), as measured by OCT angiography, were assessed in MT type 1 eyes and correlated with VA.
Results: The mean baseline best-corrected VA of MT type 1 eyes was 0.45 ± 0.28. The mean CMT was 385.19 ± 75.21 μm in MT type 1 eyes and 252.43 ± 15.77 μm in contralateral eyes (Z = - 4.113, p < 0.001). The mean vessel density of the DCP was lower in MT type 1 eyes (47.25 ± 4.69%) than in contralateral eyes (53.93 ± 2.94%) and normal eyes (59.37 ± 2.50%) (Z = - 3.492, - 4.099; p < 0.001, < 0.001). The baseline logMAR VA was correlated with CMT (r = 0.682, p = 0.007), SCP density (r = - 0.652, p = 0.012), DCP density (r = - 0.700, p = 0.005), total area of EZ disruption (r = 0.649, p = 0.012); and total lengths of EZ (r = 0.681, p = 0.007), ELM (r = 0.699, p = 0.005) and DRIL (r = 0.707, p = 0.005) disruption in the 1-mm-diameter foveal region in MT type 1 eyes.
Conclusions: Decreased DCP density and the presence of DRIL may be predictive biomarkers of VA in MT type 1. CMT, SCP density, total area of EZ disruption, and lengths of EZ and ELM disruption within the 1-mm-diameter central region were strongly associated with VA.
Keywords: Disorganization of the retinal inner layers; Ellipsoid zone disruption; Macular telangiectasia type 1; Optical coherence tomography angiography.
Conflict of interest statement
Ethics approval and consent to participate
This study was approved by the Institutional Review Board of the Eye and ENT Hospital of Fudan University. All procedures were approved by the principles of the Declaration of Helsinki. Written informed consent was obtained from all participants or their guardians.
Consent for publication
Not Applicable
Competing interests
The authors declare that they have no competing interests.
Publisher’s Note
Springer Nature remains neutral with regard to jurisdictional claims in published maps and institutional affiliations.
Figures
References
-
- Demirkaya N, van Dijk HW, van Schuppen SM, Abramoff MD, Garvin MK, Sonka M, et al. Effect of age on individual retinal layer thickness in normal eyes as measured with spectral-domain optical coherence tomography. Invest Ophthalmol Vis Sci. 2013;54(7):4934–4940. doi: 10.1167/iovs.13-11913. - DOI - PMC - PubMed
MeSH terms
Substances
Grants and funding
LinkOut - more resources
Full Text Sources
Other Literature Sources
Miscellaneous
