. 2018 Mar 5;15(1):66.
doi: 10.1186/s12974-018-1107-7.

Nitrosative damage during retrovirus infection-induced neuropathic pain

Affiliations

Nitrosative damage during retrovirus infection-induced neuropathic pain

Priyanka Chauhan et al. J Neuroinflammation. .

Abstract

Background: Peripheral neuropathy is currently the most common neurological complication in HIV-infected individuals, occurring in 35-50% of patients undergoing combination anti-retroviral therapy. Data have shown that distal symmetric polyneuropathy develops in mice by 6 weeks following infection with the LP-BM5 retrovirus mixture. Previous work from our laboratory has demonstrated that glial cells modulate antiviral T-cell effector responses through the programmed death (PD)-1: PD-L1 pathway, thereby limiting the deleterious consequences of unrestrained neuroinflammation.

Methods: Using the MouseMet electronic von Frey system, we assessed hind-paw mechanical hypersensitivity in LP-BM5-infected wild-type (WT) and PD-1 KO animals. Using multi-color flow cytometry, we quantitatively assessed cellular infiltration and microglial activation. Using real-time RT-PCR, we assessed viral load, expression of IFN-γ, iNOS, and MHC class II. Using western blotting, we measured protein nitrosylation within the lumbar spinal cord (LSC) and dorsal root ganglion (DRG). Histochemical staining was performed to analyze the presence of CD3, ionized calcium binding adaptor molecule (Iba)-1, MHCII, nitrotyrosine, isolectin B4 (IB4) binding, and neurofilament 200 (NF200). Statistical analyses were carried out using graphpad prism.

Results: Hind-paw mechanical hypersensitivity observed in LP-BM5-infected animals was associated with significantly increased lymphocyte infiltration into the spinal cord and DRG. We also observed elevated expression of IFN-γ (in LSC and DRG) and MHC II (on resident microglia in LSC). We detected elevated levels of 3-nitrotyrosine within the LSC and DRG of LP-BM5-infected animals, an indicator of nitric oxide (NO)-induced protein damage. Moreover, we observed 3-nitrotyrosine in both small (IB4+) and large (NF200+) DRG sensory neurons. Additionally, infected PD-1 KO animals displayed significantly greater mechanical hypersensitivity than WT or uninfected mice at 4 weeks post-infection (p.i.). Accelerated onset of hind-paw hypersensitivity in PD-1 KO animals was associated with significantly increased infiltration of CD4+ and CD8+ T lymphocytes, macrophages, and microglial activation at early time points. Importantly, we also observed elevated levels of 3-nitrotyrosine and iNOS in infected PD-1 KO animals when compared with WT animals.

Conclusions: Results reported here connect peripheral immune cell infiltration and reactive gliosis with nitrosative damage. These data may help elucidate how retroviral infection-induced neuroinflammatory networks contribute to nerve damage and neuropathic pain.

Keywords: LP-BM5; MAIDS; Neuropathic pain; Nitrosylation; PD-1 KO; Reactive gliosis.


Conflict of interest statement

Ethics approval

This study was carried out in strict accordance with recommendations in the Guide for the Care and Use of Laboratory Animals of the National Institutes of Health. The protocol was approved by the Institutional Animal Care and Use Committee (protocol number: 1709-35110A and breeding protocol number: 1702-34587A) of the University of Minnesota.

Consent for publication

Not applicable.

Competing interests

The authors declare that they have no competing interests.

Publisher’s Note

Springer Nature remains neutral with regard to jurisdictional claims in published maps and institutional affiliations.

Figures
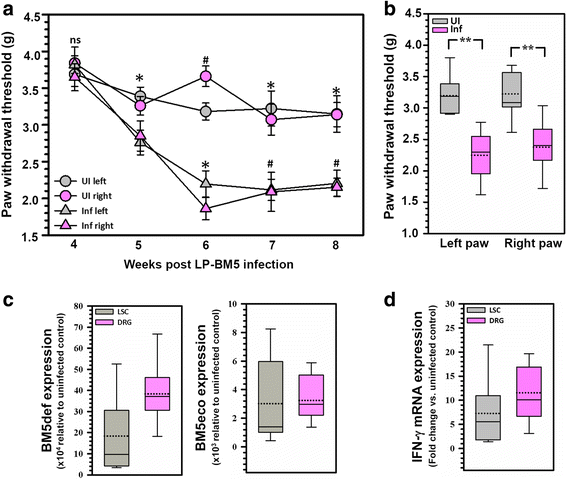
Fig. 1
Fig. 1
Establishment of LP-BM5 infection-induced neuropathic pain and associated chronic immune activation. a WT animals were randomly assigned to LP-BM5-infected (Inf) and uninfected (UI) groups (n = 10/group). Hind-paw withdrawal threshold (in grams) was assessed on both left and right paws at various time points via MouseMet electronic Von Frey. *p < 0.05 between infected (Inf) and uninfected (UI) WT animals, and #p < 0.05 between infected (Inf) and uninfected (UI) WT animals (left and right paws, respectively). Data are presented as mean ± SEM paw withdrawal threshold. b Hind-paw withdrawal threshold (in grams) was assessed on both left and right paws at 10 weeks p.i. via MouseMet electronic Von Frey (n = 10/group). **p < 0.01 between infected (Inf) and uninfected (UI) WT animals. Data are presented as mean ± SEM paw withdrawal threshold. c LP-BM5 viral loads were determined by measuring the levels of BM5def (disease-inducing virus) and BM5eco (helper virus) gag RNA in the LSC (L3 to L5) and DRG (n = 12) during MAIDS at 10 weeks p.i. via real-time RT-PCR. Results are presented as box plots of pooled data from individual animals. d Chronic IFN-γ mRNA production was measured in LSC (L3 to L5) and DRG (n = 12) at 10 weeks p.i. via real-time RT-PCR. Results are presented as box plots of pooled data from individual animals
Fig. 2
Fig. 2
Increased infiltration of CD4+ and CD8+ T-cells into the spinal cord of LP-BM5-infected animals. Spinal cord-infiltrating leukocytes were banded on a 30–70% Percoll cushion, collected, and labeled with Abs specific for anti-CD45-PE-Cy5, anti-CD11b-AF700, anti-CD4-BV510, and anti-CD8-PE-Cy7 for analysis by flow cytometry. a Representative contour plots show the percentages of CD4+ and CD8+ T lymphocytes within uninfected and infected (LP-BM5) spinal cords of WT at 10 weeks p.i. b CD4+ T-cell infiltration into the spinal cord of uninfected and LP-BM5-infected animals. c CD8+ T-cell infiltration into the spinal cord of uninfected and infected animals. Pooled data present absolute numbers (mean ± SD) of CD4+ and CD8+ T-cells from two independent experiments using 4–6 animals per group. **p < 0.01. d IHC staining of infiltrating CD3+ T-cells in LSC (L3 to L5) sections from infected animals. White arrows indicate CD3+ T cells (red). Scale bar = 100 μm. The right panel indicates the × 40 image of the rectangular area. Scale bar = 10 μm
Fig. 3
Fig. 3
Increased infiltration of CD4+ T-cells into the DRG of LP-BM5-infected animals. Mononuclear cells from six ganglia (L3-L5) were isolated using a non-enzymatic dissociation method and were labeled with Abs specific for anti-CD45-PE-Cy5, anti-CD4-BV510, and anti-CD8-PE-Cy7 for analysis by flow cytometry. a Representative contour plots show the percentages of CD4+ and CD8+ T lymphocytes within uninfected and infected (LP-BM5) DRG of WT animals at 10 weeks p.i. b CD4+ T-cell infiltration into the DRG of uninfected and LP-BM5-infected animals. c CD8+ T-cell infiltration into the DRG of uninfected and infected animals. Pooled data present absolute numbers (mean ± SD) of CD4+ and CD8+ T-cells from two independent experiments using 4–6 animals per group. *p < 0.05
Fig. 4
Fig. 4
Chronic activation of resident microglial cells in LP-BM5-infected animals. a IHC staining of the macrophage/microglial cell marker, Iba-1 (red) within infected LSC (L3-L5), and DRG at 10 weeks p.i. Green staining is for neuron-specific class III β-tubulin. Blue is DAPI staining. Scale bar = 20 μm for LSC and 50 μm for DRG. b Resident microglial cells in the spinal cord of uninfected and infected animals were analyzed for expression of the activation marker MHCII. Contour plots showing the frequency of microglial cells expressing MHCII within uninfected and infected (LP-BM5) spinal cords of animals at 10 weeks p.i. Pooled data present the frequency (mean ± SD) of microglial cells expressing MHCII in spinal cord of uninfected and infected animals at 10 weeks p.i. from two independent experiments using 4–6 animals per group. Inset, isotype control. c MHCII expression was measured by real-time RT-PCR in the LSC of uninfected and infected (LP-BM5) animals (n = 4–6) at 10 weeks p.i. d IHC staining of MHCII (brown) in LSC sections from uninfected and infected (LP-BM5) animals. Scale bar = 5 μm
Fig. 5
Fig. 5
NO-induced damage within the LSC and DRG of LP-BM5-infected animals. a Western blot of LSC tissue lysates from uninfected (UI, lanes 1 to 4) and LP-BM5-infected (Inf, lanes 5 to 9) animals probed with anti-3-nitrotyrosine antibodies. Each lane displays tissue extract from one animal at 10 weeks p.i. The band labeled a identifies a high molecular weight (MW) protein band, while the b band points out a lower MW protein, both of which are nitrosylated. The signal intensity of both the a and b protein bands for uninfected (UI) and infected (IF) animals was measured using densitometry and plotted. **p < 0.01 (b) Western blot of lysates obtained from uninfected (UI, lane 1) and LP-BM5 infected (Inf, lanes 2 to 5) animals’ DRG (L3-L5) probed with anti-3-nitrotyrosine antibodies. Each lane displays a tissue extract pooled from three individual animals at 10 weeks p.i. The band labeled a represents a high MW protein, and the b band represents the lower MW protein band that are nitrosylated. The signal intensity of both a and b protein bands for uninfected (UI) and infected (IF) animals was measured and is plotted alongside. **p < 0.01 M = protein molecular weight marker ranging from size 15 to 250 kD. c IHC staining of LSC and DRG sections (L3-L5) from uninfected and infected (LP-BM5) mice with anti-3-nitrotyrosine antibody (brown) and mouse IgG isotype antibody. Scale bar = 100 μm for LSC and 50 μm for DRG
Fig. 6
Fig. 6
Nitrosative damage within DRG sensory neurons of LP-BM5-infected animals. Histochemistry to identify IB4-binding, NF200, nitrotyrosine, and DAPI was carried out on sections of DRG (L3-L5) at 10 weeks post-LP-BM5 infection. a Representative images depicting labelling of neuronal cells with IB4 (green), nitrotyrosine (red), DAPI (blue), and a merged image showing triple staining with IB4, nitrotyrosine, and DAPI. White arrows indicate the co-labeled neurons. b Representative images depicting labelling of neuronal cells with NF200 (green), nitrotyrosine (red), DAPI (blue), and a merged image showing triple staining with NF200, nitrotyrosine, and DAPI. White arrows indicate co-labeled neurons. Scale bar = 50 μm. c Graphical representation of the percentage of neurons showing double-immunolabeling for nitrotyrosine (NT) and IB4 in the DRG of LP-BM5-infected animals. d Column graph showing the percentage of neurons co-labeled with NT and NF200 in the DRG of LP-BM5-infected mice. n = 3–4 mice/group. Values are presented as mean ± SEM. *p < 0.05
Fig. 7
Fig. 7
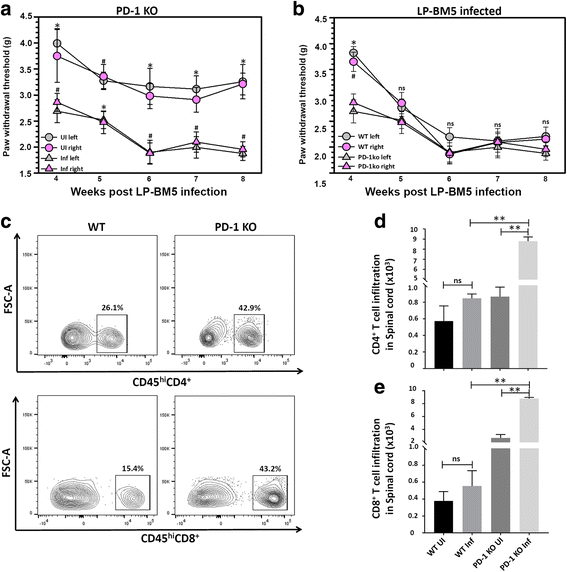
Accelerated onset of hind-paw mechanical hypersensitivity in PD-1 KO animals infected with LP-BM5 and associated cellular infiltration. Hind-paw withdrawal threshold was assessed in both WT, as well as PD-1 KO, animals as described in Fig. 1. a Paw withdrawal threshold (in grams) was assessed at various time points in LP-BM5-infected (Inf) PD-1 KO animals, as well their age-matched uninfected (UI) littermates (n = 10/group). *p < 0.05 between infected (Inf) and uninfected (UI) PD-1 KO animals, and #p < 0.05 between PD-1KO-infected (Inf) and uninfected (UI) PD-1 KO animals (left and right paws, respectively). b Paw withdrawal threshold was assessed at various time points in LP-BM5-infected WT, as well as PD-1 KO animals (n = 10/group). *p < 0.05 between infected PD-1 KO and infected WT animals, and #p < 0.05 between infected PD-1 KO and infected WT animals (left and right paws, respectively). Data are presented as mean ± SEM paw withdrawal threshold. c Representative contour plots show the percentages of CD4+ and CD8+ T lymphocytes within infected spinal cords of WT, as well as PD-1 KO animals at 4 weeks p.i. d CD4+ T-cell infiltration into the spinal cord of uninfected and infected WT and PD-1 KO animals. e CD8+ T-cell infiltration into the spinal cord of uninfected and infected WT and PD-1 KO animals. Pooled data present absolute numbers (mean ± SD) of CD4+ and CD8+ T-cells from two independent experiments using three animals per group. **p < 0.01
Fig. 8
Fig. 8
Increased macrophage infiltration and chronic microglial activation in the spinal cord of LP-BM5-infected PD-1 KO animals. a Representative dot plot to distinguish infiltrating macrophages from tissue-resident microglia. b Absolute numbers of macrophages in the spinal cord of uninfected (UI) and infected (Inf) WT and PD-1 KO animals. Pooled data present absolute numbers (mean ± SD) of infiltrating macrophages within infected and uninfected WT and PD-1 KO animals at 4 weeks p.i. from two independent experiments using three animals per group. **p < 0.01. c Pooled data present the frequency (mean ± SD) of microglial cells expressing MHCII in spinal cord tissues of uninfected (UI) and infected (Inf) WT as well as PD-1 KO animals at 4 weeks p.i. *p < 0.05, **p < 0.01
Fig. 9
Fig. 9
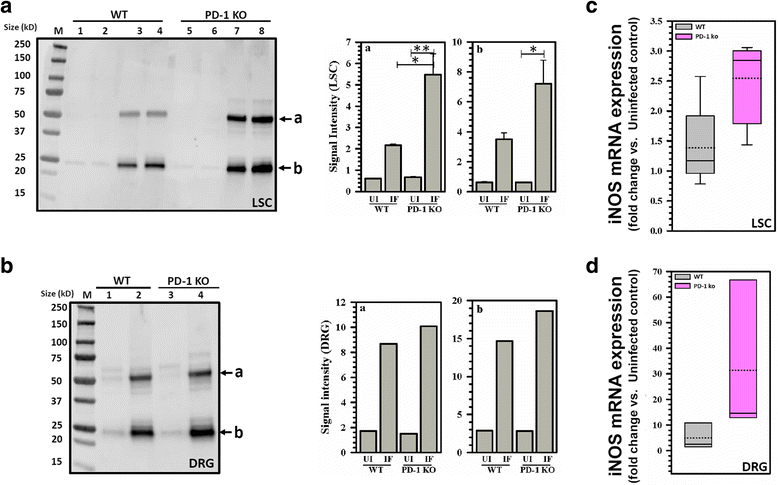
NO-induced damage within the LSC and DRG of LP-BM5 infected PD-1 KO animals. a Western blot of LSC tissue lysates from uninfected (UI) and LP-BM5-infected (Inf) WT (UI, lanes 1 and 2; Inf, lanes 3 and 4) and PD-1 KO (UI, lanes 5 and 6; Inf, lanes 7 and 8) animals probed with anti-3-nitrotyrosine antibodies. Each lane displays tissue extract from one individual animal at 10 weeks p.i. The band labeled a identifies a high molecular weight (MW) protein band, while the b band points out a lower MW protein, both of which are nitrosylated. The signal intensity of both a and b protein bands observed in the lysates of uninfected and LP-BM5-infected WT and PD-1 KO animals was measured using densitometry and plotted alongside. *p < 0.05, **p < 0.01 (b) western blot of lysates obtained from uninfected (UI) and LP-BM5-infected (IF) WT (UI, lane 1 and IF, lane 2) and PD-1 KO (UI, lane 3 and IF, lane 4) animals’ DRG (L3-L5) probed with anti-3-nitrotyrosine antibodies. Each lane displays tissue extract pooled from 3 animals at 10 weeks p.i. The band labeled a identifies a high MW protein band, and b represents the lower MW protein band that are nitrosylated. The signal intensity of both a and b protein bands observed was measured and plotted alongside. M = protein molecular weight marker ranging from size 15 to 250 kD. c iNOS expression was measured by real-time RT-PCR in the LSC (L3-L5) of LP-BM5-infected WT and PD-1 KO animals at 10 weeks p.i. (n = 4–6). d iNOS mRNA expression in DRG tissues at 10 weeks p.i. via real-time RT-PCR (n = 4–6). Results are presented as box plots of pooled data from individual animals

Similar articles

Cited by

References

    1. Morgello S, Estanislao L, Simpson D, Geraci A, DiRocco A, Gerits P, Ryan E, Yakoushina T, Khan S, Mahboob R, et al. HIV-associated distal sensory polyneuropathy in the era of highly active antiretroviral therapy: the Manhattan HIV brain Bank. Arch Neurol. 2004;61:546–551. doi: 10.1001/archneur.61.4.546. - DOI - PubMed
    1. Ellis RJ, Rosario D, Clifford DB, McArthur JC, Simpson D, Alexander T, Gelman BB, Vaida F, Collier A, Marra CM, et al. Continued high prevalence and adverse clinical impact of human immunodeficiency virus-associated sensory neuropathy in the era of combination antiretroviral therapy: the CHARTER study. Arch Neurol. 2010;67:552–558. doi: 10.1001/archneurol.2010.76. - DOI - PMC - PubMed
    1. Evans SR, Ellis RJ, Chen H, Yeh TM, Lee AJ, Schifitto G, Wu K, Bosch RJ, JC MA, Simpson DM, Clifford DB. Peripheral neuropathy in HIV: prevalence and risk factors. AIDS. 2011;25:919–928. doi: 10.1097/QAD.0b013e328345889d. - DOI - PMC - PubMed
    1. Phillips TJ, Cherry CL, Cox S, Marshall SJ, Rice AS. Pharmacological treatment of painful HIV-associated sensory neuropathy: a systematic review and meta-analysis of randomised controlled trials. PLoS One. 2010;5:e14433. doi: 10.1371/journal.pone.0014433. - DOI - PMC - PubMed
    1. Gonzalez-Duarte A, Robinson-Papp J, Simpson DM. Diagnosis and management of HIV-associated neuropathy. Neurol Clin. 2008;26:821–832. doi: 10.1016/j.ncl.2008.04.001. - DOI - PubMed

MeSH terms

LinkOut - more resources