

Effects of isoflurane, sevoflurane, propofol and alfaxalone on brain metabolism in dogs assessed by proton magnetic resonance spectroscopy (1H MRS)
- PMID: 29506576
- PMCID: PMC5839062
- DOI: 10.1186/s12917-018-1396-1
Effects of isoflurane, sevoflurane, propofol and alfaxalone on brain metabolism in dogs assessed by proton magnetic resonance spectroscopy (1H MRS)
Abstract
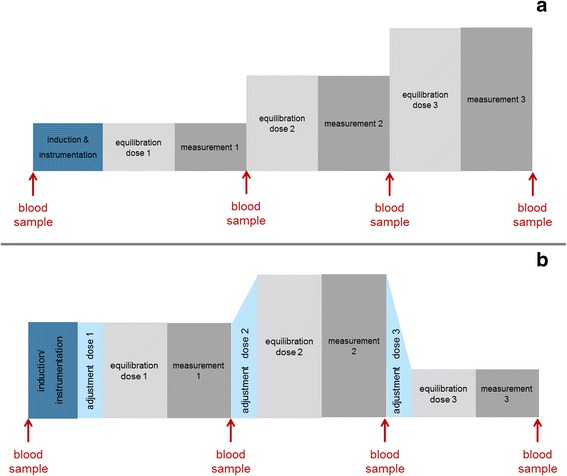
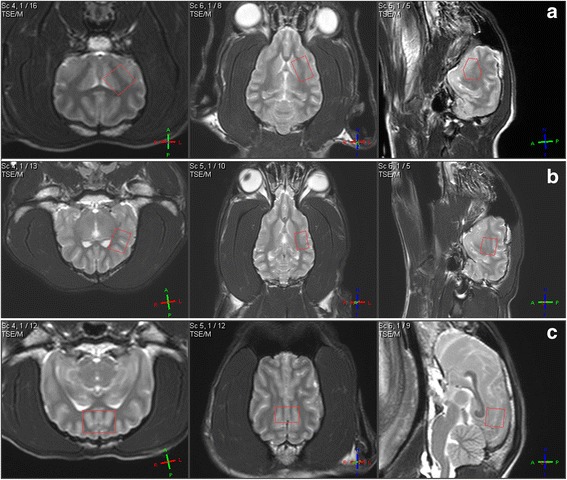
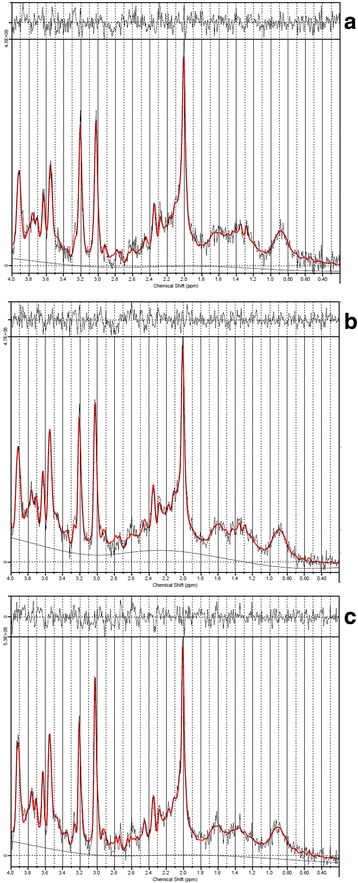
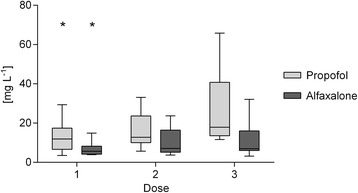
Background: The purpose of this study was to determine the effects of isoflurane, sevoflurane, propofol and alfaxalone on the canine brain metabolite bioprofile, measured with single voxel short echo time proton magnetic resonance spectroscopy at 3 Tesla. Ten adult healthy Beagle dogs were assigned to receive isoflurane, sevoflurane, propofol and alfaxalone at 3 different dose rates each in a randomized cross-over study design. Doses for isoflurane, sevoflurane, propofol and alfaxalone were FE'Iso 1.7 vol%, 2.1 vol%, 2.8 vol%, FE'Sevo 2.8 vol%, 3.5 vol% and 4.7 vol%, 30, 45 and 60 mg kg- 1 h- 1 and 10, 15 and 20 mg kg- 1 h- 1 respectively. A single voxel Point Resolved Spectroscopy Sequence was performed on a 3 T MRI scanner in three brain regions (basal ganglia, parietal and occipital lobes). Spectral data were analyzed with LCModel. Concentration of total N-acetylaspartate (tNAA), choline, creatine, inositol and glutamine and glutamate complex (Glx) relative to water content was obtained. Plasma concentration of lactate, glucose, triglycerides, propofol and alfaxalone were determined. Statistics were performed using repeated measures ANOVA or Wilcoxon Sign Rank test with alpha = 5%.
Results: Plasma glucose increased with isoflurane, sevoflurane and alfaxalone but decreased with propofol. Plasma lactate increased with all anesthetics (isoflurane > sevoflurane > propofol > alfaxalone). Cerebral lactate could not be detected. Only minor changes in cerebral metabolite concentrations of tNAA, choline, inositol, creatine and Glx occurred with anesthetic dose changes.
Conclusion: The metabolomic profile detected with proton magnetic resonance spectroscopy at 3 Tesla of canine brain showed only minor differences between doses and anesthetics related to tNAA, choline, creatine, inositol and Glx.
Keywords: Anesthesia; Canine; Cerebral; Glucose; Lactate; LcModel; MRI; PRESS; Plasma.
Conflict of interest statement
Ethics approval
All animal procedures were reviewed and approved by the ethical committee for animal experimentation of the Federal State Office for Consumer Protection and Food Safety of Lower Saxony, Germany (3392 42,502–04-13/1252) according to the German animal protection law.
Consent for publication
Not applicable.
Competing interests
MGR and KP are employed by Jurox Pty Ltd.
Publisher’s Note
Springer Nature remains neutral with regard to jurisdictional claims in published maps and institutional affiliations.
Figures
References
Publication types
MeSH terms
Substances
LinkOut - more resources
Full Text Sources
Other Literature Sources
