

Associations of vegetable and fruit consumption with metabolic syndrome. A meta-analysis of observational studies
- PMID: 29506604
- PMCID: PMC10261586
- DOI: 10.1017/S1368980018000381
Associations of vegetable and fruit consumption with metabolic syndrome. A meta-analysis of observational studies
Abstract
Objective: To examine the associations of vegetable and/or fruit consumption with metabolic syndrome (MetS).
Design: Meta-analysis of observational studies.
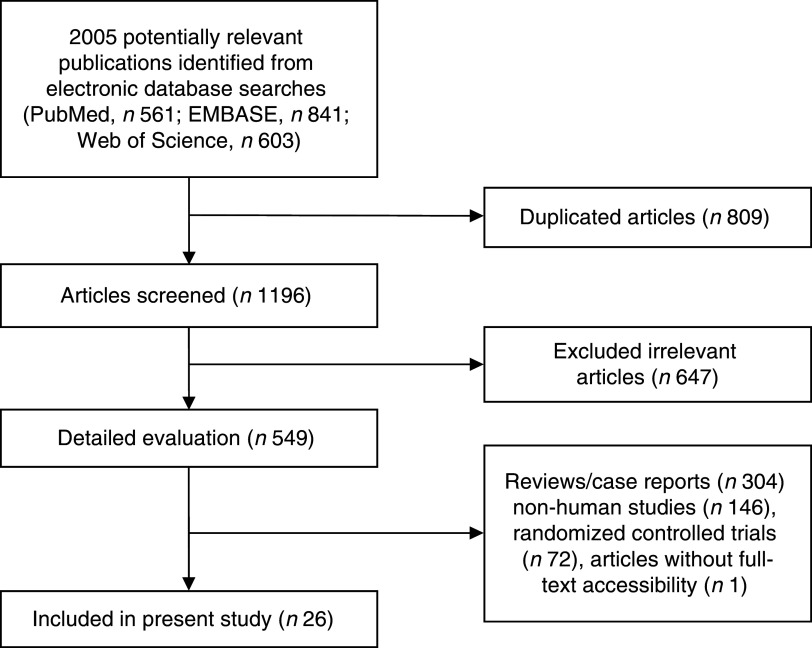
Setting: The electronic databases of PubMed, Web of Science and EMBASE were searched up to September 2017 for observational studies concerning the associations of vegetable and/or fruit consumption with MetS. The pooled relative risk (RR) of MetS for the highest v. the lowest category of vegetable and/or fruit consumption, as well as their corresponding 95 % CI, were calculated.
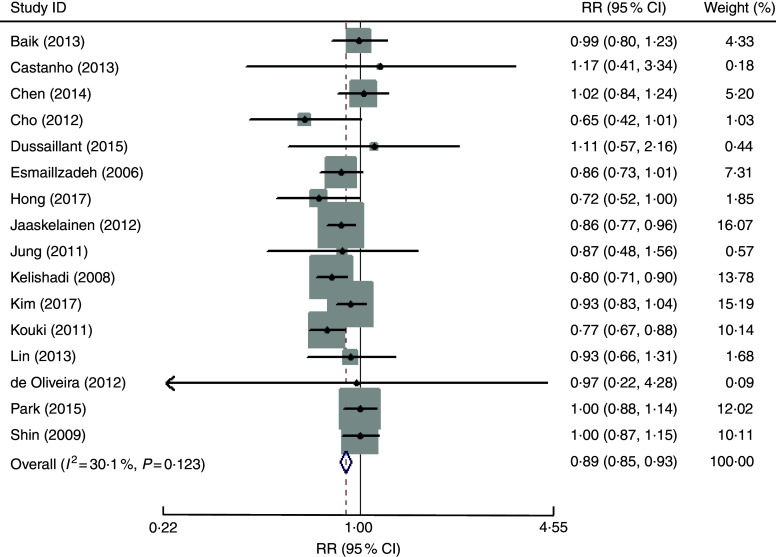
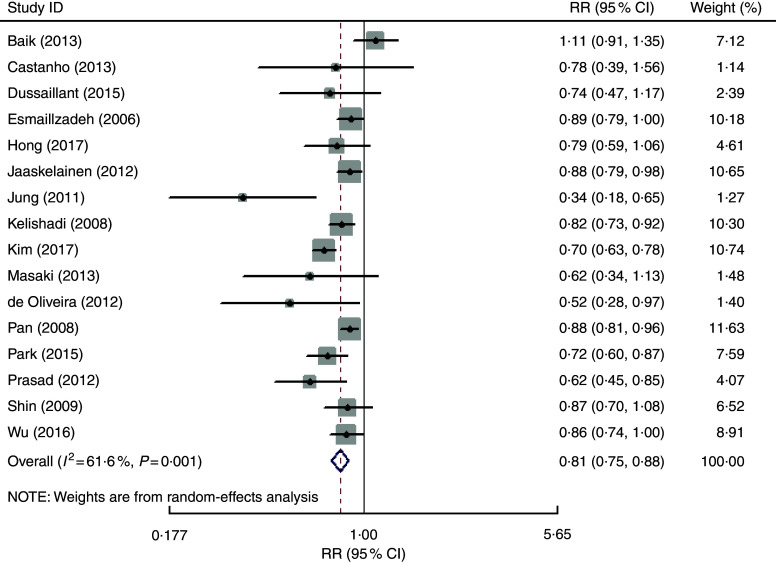
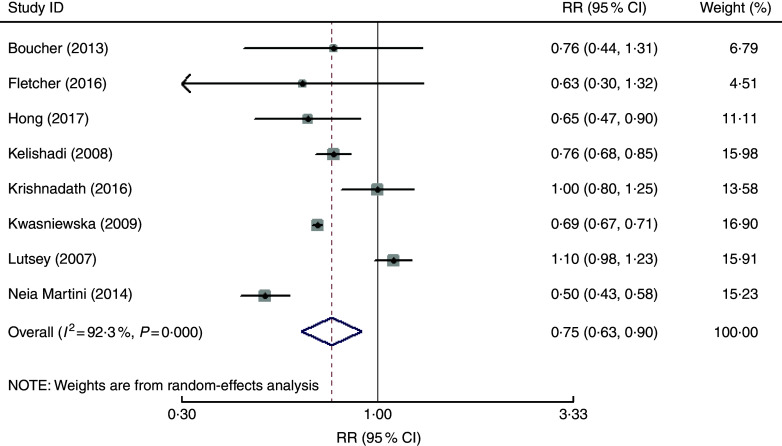
Results: A total of twenty-six observational studies (twenty cross-sectional, one case-control and five cohort studies) were included in the meta-analysis. Specifically, sixteen studies were related to vegetable consumption and the overall multivariable-adjusted RR evidenced a negative association between vegetable consumption and MetS (RR=0·89, 95 % CI 0·85, 0·93; P<0·001). For fruit consumption, sixteen studies were included and the overall multivariable-adjusted RR demonstrated that fruit consumption was inversely associated with MetS (RR=0·81, 95 % CI 0·75, 0·88; P<0·001). For vegetable and fruit consumption, eight studies were included; the overall multivariable-adjusted RR showed that vegetable and fruit consumption was also negatively associated with MetS (RR=0·75, 95 % CI 0·63, 0·90; P=0·002).
Conclusions: The existing evidence suggests that vegetable and/or fruit consumption is negatively associated with MetS. More well-designed prospective cohort studies are needed to elaborate the concerned issues further.
Keywords: Fruits; Meta-analysis; Metabolic syndrome; Observational studies; Vegetables.
Figures
References
-
- O’Neill S & O’Driscoll L (2015) Metabolic syndrome: a closer look at the growing epidemic and its associated pathologies. Obes Rev 16, 1–12. - PubMed
-
- Athyros VG, Ganotakis ES, Elisaf M et al.. (2005) The prevalence of the metabolic syndrome using the National Cholesterol Educational Program and International Diabetes Federation definitions. Curr Med Res Opin 21, 1157–1159. - PubMed
-
- Sun K, Ren M, Liu D et al.. (2014) Alcohol consumption and risk of metabolic syndrome: a meta-analysis of prospective studies. Clin Nutr 33, 596–602. - PubMed
-
- Narain A, Kwok CS & Mamas MA (2017) Soft drink intake and the risk of metabolic syndrome: a systematic review and meta-analysis. Int J Clin Pract 71, e12927. - PubMed
Publication types
MeSH terms
LinkOut - more resources
Full Text Sources
Other Literature Sources
Medical
