. 2018 Apr 23;86(5):e00878-17.
doi: 10.1128/IAI.00878-17. Print 2018 May.

Chemotaxis Allows Bacteria To Overcome Host-Generated Reactive Oxygen Species That Constrain Gland Colonization

Affiliations

Chemotaxis Allows Bacteria To Overcome Host-Generated Reactive Oxygen Species That Constrain Gland Colonization

Kieran D Collins et al. Infect Immun. .

Abstract

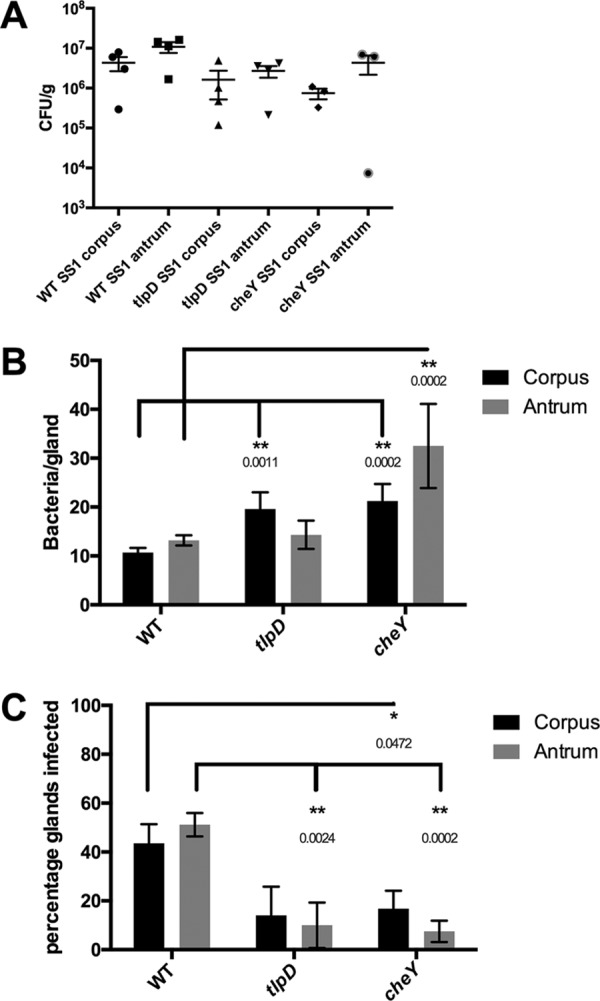
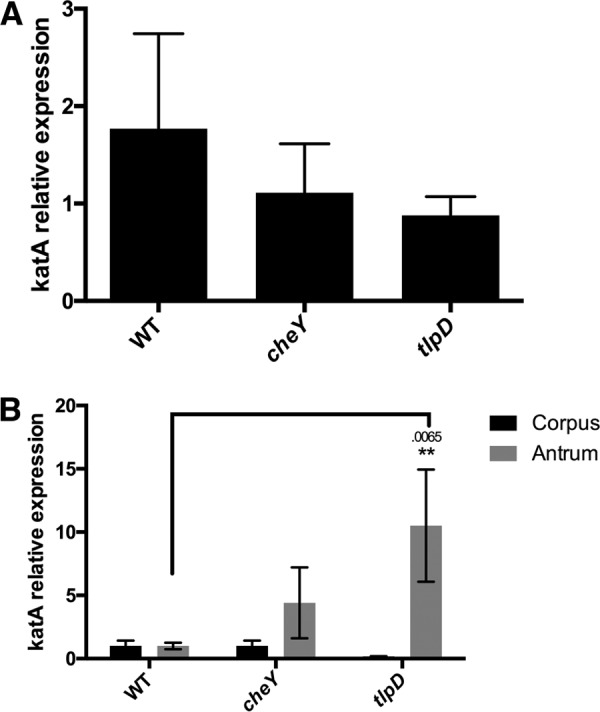
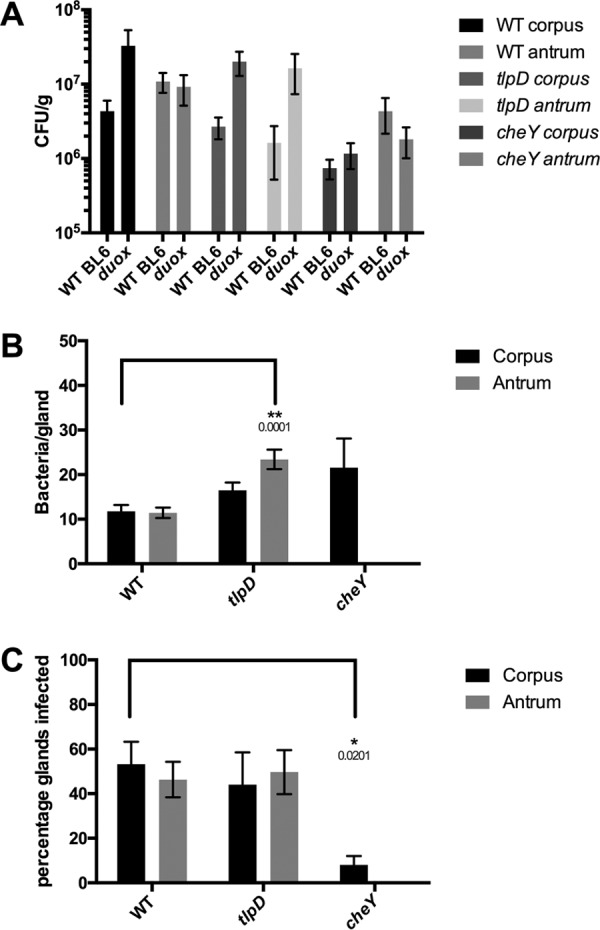
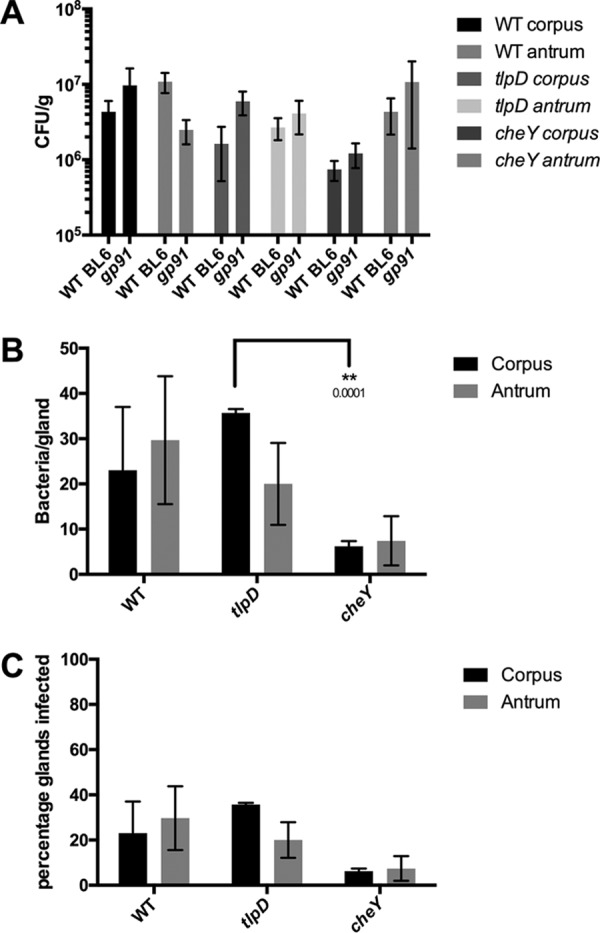
The epithelial layer of the gastrointestinal tract contains invaginations, called glands or crypts, which are colonized by symbiotic and pathogenic microorganisms and may function as designated niches for certain species. Factors that control gland colonization are poorly understood, but bacterial chemotaxis aids occupation of these sites. We report here that a Helicobacter pylori cytoplasmic chemoreceptor, TlpD, is required for gland colonization in the stomach. tlpD mutants demonstrate gland colonization defects characterized by a reduction in the percentage of glands colonized but not in the number of bacteria per gland. Consistent with TlpD's reported role in reactive oxygen species (ROS) avoidance, tlpD mutants showed hallmarks of exposure to high ROS. To assess the role of host-generated ROS in TlpD-dependent gland colonization, we utilized mice that lack either the ability to generate epithelial hydrogen peroxide or immune cell superoxide. tlpD gland colonization defects were rescued to wild-type H. pylori levels in both of these mutants. These results suggest that multiple types of innate immune-generated ROS production limit gland colonization and that bacteria have evolved specific mechanisms to sense and direct their motility in response to this signal and thus spread throughout tissue.

Keywords: MCP; biogeography; chemoreceptors; crypts; glands; reactive oxygen species; signal transduction; stomach.


Figures

FIG 1
FIG 1
tlpD mutants have deficits in gland occupancy in WT mice but not in colonization of total tissue or individual glands. A comparison of colonization levels of WT mice by H. pylori GFP+ SS1 WT, tlpD mutant, and cheY mutant strains is shown. Mice were orally infected, and stomachs were collected and analyzed for tissue and gland colonization after 2 weeks of infection. (A) Numbers of CFU/g for corpus and antrum regions for mice infected with H. pylori GFP+ SS1 WT (n = 4), tlpD mutant (n = 4), and cheY mutant (n = 3) strains. Differences between groups were not statistically significant. (B) Gland loads in the isolated corpus and antral glands. These numbers are the average number of bacteria counted per gland, excluding uninfected glands. Numbers of infected glands were as follows: WT-infected corpus, 436 glands from six mice; WT-infected antrum, 508 glands from six mice; tlpD mutant-infected corpus, 67 glands from five mice; tlpD mutant-infected antrum, 48 glands from five mice; cheY mutant-infected corpus, 58 glands from four mice; cheY mutant-infected antrum, 24 glands from four mice. (C) Gland occupancy in the isolated corpus and antral glands, representing the percentage of glands infected with the indicated H. pylori strain. Error bars represent standard errors of the mean (SEM) for all panels. Numbers of mice infected are the same as described for gland loads. Statistical differences are indicated by * (P < 0.05) and ** (P < 0.01) as analyzed by Student's t test.
FIG 2
FIG 2
tlpD mutants show evidence of ROS exposure in vivo. A comparison of catalase mRNA expression levels in vitro and in vivo between H. pylori strains is shown. (A) Mean ± SEM of fold change increases in katA mRNA of H. pylori strains exposed to 1 mM H2O2 for 20 min, normalized to gapB. Differences between groups were not significant. (B) Comparison of mean ± SEM of katA expression levels by H. pylori strains in three WT mice, normalized to gapB. Statistical differences are indicated by * (P < 0.05) and ** (P < 0.01) as analyzed by Student's t test, with actual P values indicated above the bar. gapB expression was insensitive to H2O2 exposure based on comparison to 16S rRNA.
FIG 3
FIG 3
Loss of epithelial H2O2 rescues tlpD mutant gland defects. Colonization of Duoxa−/− mice by WT, tlpD mutant, or cheY mutant GFP+ H. pylori SS1 strains at 2 weeks postinfection is shown. Mice were orally infected, and stomachs were collected and analyzed for tissue and gland colonization. (A) Numbers of CFU/g at 2 weeks postinfection for corpus and antrum regions infected with WT (n = 4), tlpD mutant (n = 5), and cheY mutant (n = 5) GFP+ H. pylori SS1 strains. Data for WT mice (referred to as WT BL6 in the figure) are the same as those in Fig. 1 and are displayed here for comparison. Duox refers to Duoxa−/− mice in the figure. (B) Gland loads in the isolated corpus and antral glands, representing the average number of bacteria counted per gland, excluding uninfected glands. Numbers of infected glands were as follows: WT-infected corpus, 313 glands from six mice; WT-infected antrum, 472 glands from six mice; tlpD mutant-infected corpus, 132 from six mice; tlpD mutant-infected antrum, 149 glands from three mice; cheY mutant-infected corpus, 24 glands from three mice. (C) Gland occupancy in the isolated corpus and antral glands, representing the percentage of glands infected with the indicated H. pylori strain. Error bars represent SEM for all panels. Numbers of mice infected are the same as described for gland loads. Statistical differences are indicated by * (P < 0.05) and ** (P < 0.01) as analyzed by Student's t test.
FIG 4
FIG 4
Loss of immune superoxide rescues tlpD mutant gland defects. Colonization of Cybb−/− mice by WT, tlpD mutant, or cheY mutant GFP+ H. pylori SS1 strains at 2 weeks postinfection is shown. Mice were orally infected, and stomachs were collected and analyzed for tissue and gland colonization. (A) Numbers of CFU/g at 2 weeks postinfection for corpus and antrum regions using WT (n = 6), tlpD mutant (n = 14), and cheY mutant (n = 6) GFP+ H. pylori SS1 strains. Data for WT mice are the same as those in Fig. 1 and are displayed here for comparison. WT BL6 refers to wild type and gp91 refers to Cybb−/− mice. (B) Gland loads in the isolated corpus and antral glands, representing the average number of bacteria counted per gland, excluding uninfected glands. Numbers of infected glands are as follows: WT-infected corpus, 69 glands from three mice; WT-infected antrum, 89 glands from three mice; tlpD mutant-infected corpus, 107 glands from three mice; tlpD mutant-infected antrum, 60 glands from three mice; cheY mutant-infected corpus, 31 glands from three mice; cheY mutant-infected antrum, 37 glands from three mice. (C) Gland occupancy in the isolated corpus and antral glands, representing the percentage of glands infected with the indicated H. pylori strain. Error bars represent SEM for all panels. Numbers of mice infected are the same as described for gland loads. Statistical differences are indicated by * (P < 0.05) and ** (P < 0.01) as analyzed by Student t test.

References

    1. Millet YA, Alvarez D, Ringgaard S, von Andrian UH, Davis BM, Waldor MK. 2014. Insights into Vibrio cholerae intestinal colonization from monitoring fluorescently labeled bacteria. PLoS Pathog 10:e1004405. doi:10.1371/journal.ppat.1004405. - DOI - PMC - PubMed
    1. Petnicki-Ocwieja T, Hrncir T, Liu Y-J, Biswas A, Hudcovic T, Tlaskalova-Hogenova H, Kobayashi KS. 2009. Nod2 is required for the regulation of commensal microbiota in the intestine. Proc Natl Acad Sci U S A 106:15813–15818. doi:10.1073/pnas.0907722106. - DOI - PMC - PubMed
    1. Macpherson AJ, Slack E, Geuking MB, McCoy KD. 2009. The mucosal firewalls against commensal intestinal microbes. Semin Immunopathol 31:145–149. doi:10.1007/s00281-009-0174-3. - DOI - PubMed
    1. Lee SM, Donaldson GP, Mikulski Z, Boyajian S, Ley K, Mazmanian SK. 2013. Bacterial colonization factors control specificity and stability of the gut microbiota. Nature 501:426–429. doi:10.1038/nature12447. - DOI - PMC - PubMed
    1. Keilberg D, Zavros Y, Shepherd B, Salama NR, Ottemann KM. 2016. Spatial and temporal shifts in bacterial biogeography and gland occupation during the development of a chronic infection. mBio 7:e01705-16. doi:10.1128/mBio.01705-16. - DOI - PMC - PubMed

Publication types