. 2018 Mar 26;131(6):jcs207779.
doi: 10.1242/jcs.207779.

Rap1, Canoe and Mbt cooperate with Bazooka to promote zonula adherens assembly in the fly photoreceptor

Affiliations

Rap1, Canoe and Mbt cooperate with Bazooka to promote zonula adherens assembly in the fly photoreceptor

Rhian F Walther et al. J Cell Sci. .

Abstract

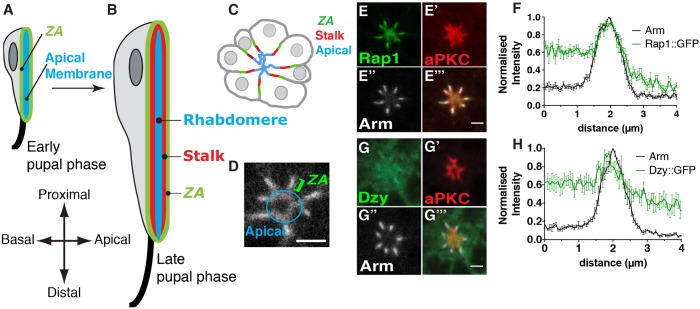
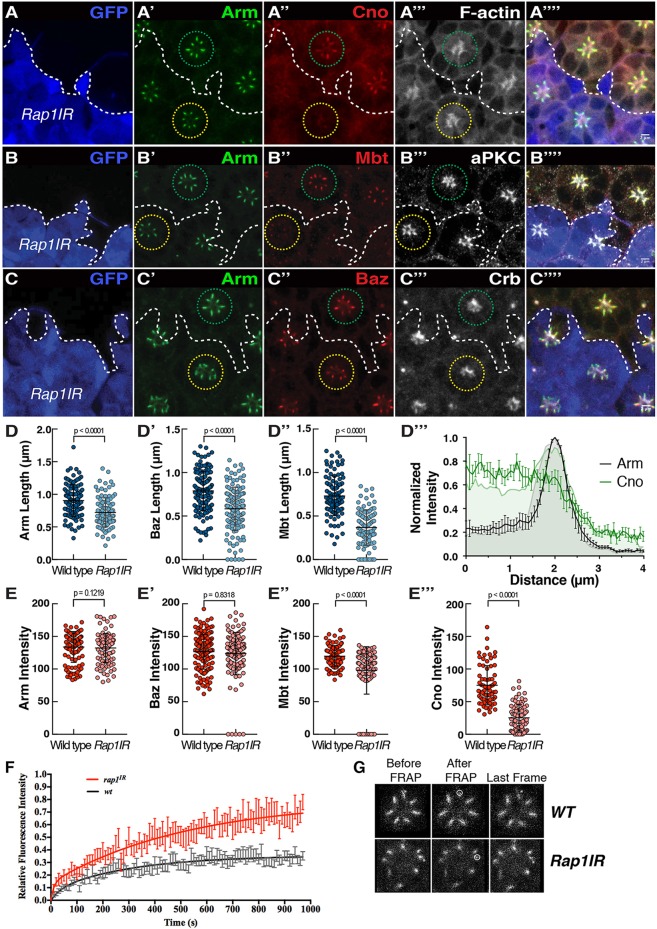
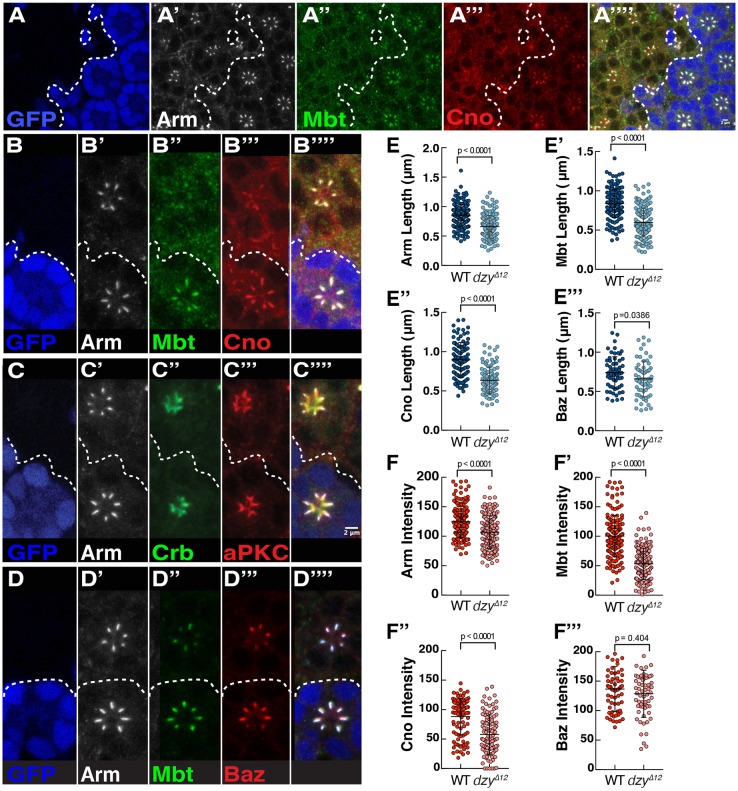
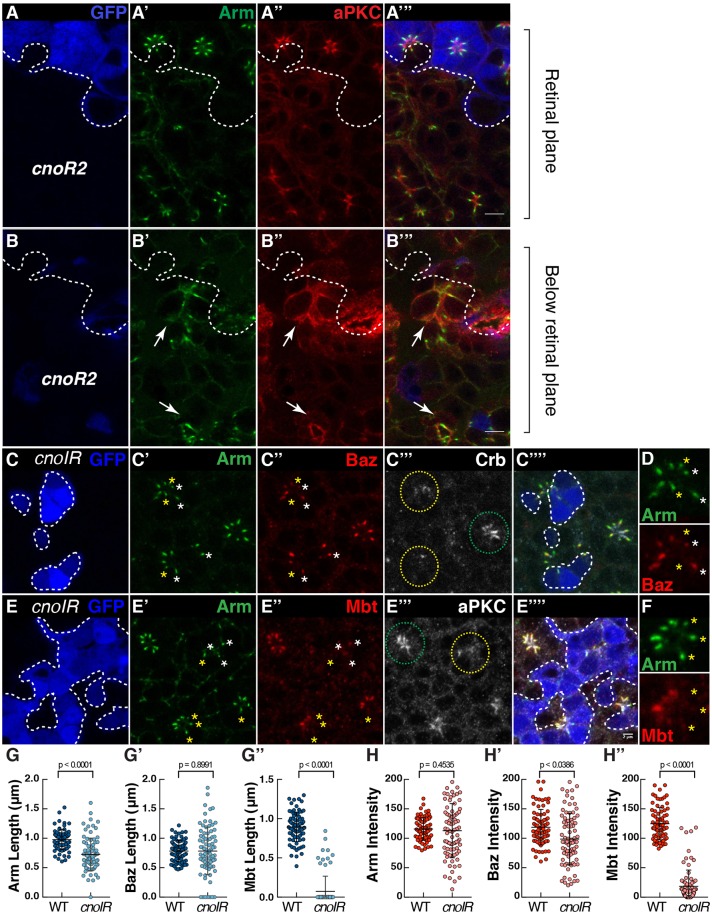
In Drosophila epithelial cells, apical exclusion of Bazooka (the Drosophila Par3 protein) defines the position of the zonula adherens (ZA), which demarcates the apical and lateral membrane and allows cells to assemble into sheets. Here, we show that the small GTPase Rap1, its effector Canoe (Cno) and the Cdc42 effector kinase Mushroom bodies tiny (Mbt), converge in regulating epithelial morphogenesis by coupling stabilization of the adherens junction (AJ) protein E-Cadherin and Bazooka retention at the ZA. Furthermore, our results show that the localization of Rap1, Cno and Mbt at the ZA is interdependent, indicating that their functions during ZA morphogenesis are interlinked. In this context, we find the Rap1-GEF Dizzy is enriched at the ZA and our results suggest that it promotes Rap1 activity during ZA morphogenesis. Altogether, we propose the Dizzy, Rap1 and Cno pathway and Mbt converge in regulating the interface between Bazooka and AJ material to promote ZA morphogenesis.

Keywords: AFDN; Bazooka; Epithelial polarity; Pak4; Par3; Photoreceptor; Rap1; Zonula adherens.


Conflict of interest statement

Competing interestsThe authors declare no competing or financial interests.

Figures

Fig. 1.
Fig. 1.
Dizzy and Rap1 are ZA-associated proteins. (A,B) Schematic representation of the developing pupal photoreceptor. (A) Early and (B) late stage pupal photoreceptors shown along the lens (top) to brain (bottom) axis of the retina. The apical membrane, which is clearly differentiated by mid pupation and by late pupation forms the rhabdomere, is depicted in blue. The stalk membranes are depicted in red and the ZA in green. The axon is depicted as a black line, at the bottom (brain or distal pole) of the cell. (C) Cross section of a cluster (ommatidium) of photoreceptors at mid pupation when the ZA (green), stalk membrane (red) and apical membrane (blue) have been specified. (D) Annotated magnification of the Rap1::GFP staining showing the apical membrane and the ZA. (E–E‴) Photoreceptors expressing Rap1::GFP (E), stained for aPKC (E′) and Arm (E″). Scale bar: 2 µm. (F) Intensity profiles of Rap1::GFP and Arm measured along the apical-basal axis. Results are mean±s.e.m. (n=8 cells from 3 retinas). (G–G‴) Photoreceptors expressing Dzy::GFP (G), stained for aPKC (G′) and Arm (G″). Scale bar: 1.5 µm. (H) Intensity profiles of Dzy::GFP and Arm measured along the apical-basal axis. Results are mean±s.e.m. (n=6 cells from 3 retinas).
Fig. 2.
Fig. 2.
Rap1 regulates the accumulation of AJ material during ZA morphogenesis. (A–C) Rap1IR cells positively labeled for GFP (blue, the edge of which is denoted by the dashed line) and stained for Arm (A′,B′,C′), Cno (A″), Mbt (B″), Baz (C″), F-actin (A‴), aPKC (B‴) and Crb (C‴). Green circle, outline of wild-type ommatidia; yellow circle, outline of Rap1IR ommatidia. Scale bars: 2 μm. (D–D″) Quantification of Arm (D), Mbt (D′), Baz (D″) domain length at the ZA. Results are mean±s.d. (n≥105). (D‴) Normalized intensity profiles of Cno (green) and Arm (gray) in WT photoreceptors (shaded profiles) and Rap1IR photoreceptors. Results are mean±s.e.m. (n=7 cells from 3 retinas). (E–E‴) Quantification of Arm (E), Mbt (E′), Baz (E″) and Cno (E‴) mean pixel intensity at the ZA. Results are mean±s.d. (n≥105). (F) FRAP curve fit for E-Cad::GFP in wild-type (black) and Rap1IR (red) photoreceptors. For both genotypes, the basal end of the developing ZA (dashed circle) was photo-bleached (G). For wild-type ZA FRAP, n=14 and for Rap1IR, n=12. Error bars are s.e.m.
Fig. 3.
Fig. 3.
Dzy regulates Cno and Mbt accumulation at the ZA. (A–A‴) dzyΔ12 mutant clone labeled by the lack of nuclear GFP (blue, the contour of which is denoted by the dashed line), stained for Arm (A′), Mbt (A″) and Cno (A″″). (B–B‴) An ommatidium mutant for dzy (lacking GFP, blue, B), stained for Arm (B′), Mbt, (B″) and Cno (B‴). (C–C‴′) Ommatidium mutant for dzy (lacking GFP, blue, C), stained for Arm (C′), Crb (C″) and aPKC (C‴). (D–D‴′) Ommatidium mutant for dzy (lacking GFP, blue, D), stained for Arm (D′), Mbt (D″) and Baz (D‴). Scale bars: 2 µm. (E–E‴) Quantification of Arm (E), Mbt (E′), Cno (E″) and Baz (E‴) domain length at the ZA. (F–F‴) Quantification of Arm (F), Mbt (F′), Cno (F″) and Baz (F‴) mean pixel intensity at the ZA. All error bars are s.d. (n≥70 from 4 retinas).
Fig. 4.
Fig. 4.
Cno regulates the coupling of Arm, Baz and Mbt at the developing ZA. (A–B) cnoR2 mutant cells (lacking GFP, blue, the contour of which is denoted by the dashed line, A,B) stained for Arm (A′,B′) and aPKC (A″,B″). White arrows indicate cnoR2 mutant photoreceptors that have delaminated from the retinal neuroepithelium. (C–F) cnoIR clones positively labeled by GFP (blue, C,E) and stained for Arm (C′,E′), Baz (C″), Crb (C‴), Mbt (E″) and aPKC (E‴). Green and yellow circles outline wild-type and cnoIR ommatidia, respectively. (D,F) A magnification of one mosaic ommatidium to highlight the absence of Baz (D) or Mbt (F) in some of the Arm domains. White stars label ZAs containing both Arm and Baz, while yellow stars indicate ZAs containing Arm but depleted for Baz (D) or containing Arm but depleted for Mbt (F). Scale bars: 2 μm. (G–G″) Quantification of Arm (G), Baz (G′) and Mbt (G″) domain length at the ZA. (H–H″) Quantification of Arm (H), Baz (H′) and Mbt (H″) mean pixel intensity at the ZA. All error bars are s.d. (n≥77 from 5 retinas).
Fig. 5.
Fig. 5.
Mbt is required for the accumulation of Cno and enrichment of Rap1 at the ZA. (A) mbtP1 mutant photoreceptors (lacking GFP, blue, the contour of which is denoted by the dashed line, A) and stained for Arm (A′) and Cno (A″). White boxes highlight ZAs within the mbtP1 mutant tissue. (B) Rap1IR photoreceptors expressing Mbt and stained for Arm (B′) and Cno (B″). (C) Rap1IR photoreceptors expressing Cno and labeled for Arm (C′), aPKC (C″) and Mbt (C‴). (D) Quantification of the Arm domain length at the ZA in wild-type photoreceptors, and for Rap1IR photoreceptors co-expressing UAS-LacZ, UAS-mbt or UAS-cno driven by NP-Gal42631. Results are mean±s.d. (n≥105 from 4 retinas). (E–G) mbtP1 mutant photoreceptors expressing rap1-Rap1::GFP (E,F,G) stained for Baz (E′), Arm (F′,G′), Crb (E″), aPKC (F″) and Cno (G″). (H) Quantification of the length of the Arm (H) and Baz (H′) domains at the ZA in the mbtP1 mutant and mbtP1 mutants expressing rap1-Rap1::GFP. Results are mean±s.d. (n≥187 from 4 retinas). (I) Intensity profiles measured for Rap1::GFP and Arm along the apical-basal axis in mbtP1 photoreceptors. (I′) Comparison of intensity profiles of Rap1::GFP measured in mbtP1 photoreceptors compared to that of wild-type photoreceptors (shaded). Results are mean±s.e.m. (n≥6 cells from 3 retinas). Scale bars: 2 μm.
Fig. 6.
Fig. 6.
Rap1, Cno and Mbt synergize with Baz to promote AJ accumulation at the plasma membrane. (A–A‴′) bazxi106 mutant cells (lacking GFP, blue, the contour of which is denoted by the dashed line, A) and stained for Arm (A′), aPKC (A″) and Mbt (A‴). (B–B‴) mbtP1, bazxi106 double mutant cells (lacking GFP, blue, B) and stained for Arm (B′) and aPKC (B″). (C–C‴′) bazxi106, Rap1IR double mutant cells (lacking GFP, blue, C) and stained for Arm (C′), aPKC (C″) and Mbt (C‴). (D) Confocal section of the cone and pigment cells in an mbtP1; Rap1IR retina stained for Arm (green) and aPKC (red). (D′–D‴′) View of the delaminated photoreceptor proximal to D. (D′) Arm, (D″) aPKC, (D‴), merge (D″,D‴); a white-dashed rectangle highlights two ommatidia that are magnified in D‴′. The white arrows point to ZA domains between flanking photoreceptors. (E) Quantification of the percentage of pairs of photoreceptors sharing a lateral Arm domain in wild-type, mbtP1, Rap1IR, baz xi106, double mbtP1; Rap1IR, double baz xi106; Rap1IR and double baz xi106, mbtP1 cells. Results are mean±s.e.m. (n≥180 from 5 retinas). Scale bars: 4 μm.

Similar articles

Cited by

References

    1. Aaku-Saraste E., Hellwig A. and Huttner W. B. (1996). Loss of occludin and functional tight junctions, but not ZO-1, during neural tube closure--remodeling of the neuroepithelium prior to neurogenesis. Dev. Biol. 180, 664-679. 10.1006/dbio.1996.0336 - DOI - PubMed
    1. Afonso C. and Henrique D. (2006). PAR3 acts as a molecular organizer to define the apical domain of chick neuroepithelial cells. J. Cell Sci. 119, 4293-4304. 10.1242/jcs.03170 - DOI - PubMed
    1. Berger S., Bulgakova N. A., Grawe F., Johnson K. and Knust E. (2007). Unraveling the genetic complexity of Drosophila stardust during photoreceptor morphogenesis and prevention of light-induced degeneration. Genetics 176, 2189-2200. 10.1534/genetics.107.071449 - DOI - PMC - PubMed
    1. Boettner B. and Van Aelst L. (2007). The Rap GTPase activator Drosophila PDZ-GEF regulates cell shape in epithelial migration and morphogenesis. Mol. Cell. Biol. 27, 7966-7980. 10.1128/MCB.01275-07 - DOI - PMC - PubMed
    1. Boettner B., Harjes P., Ishimaru S., Heke M., Fan H. Q., Qin Y., Van Aelst L. and Gaul U. (2003). The AF-6 homolog canoe acts as a Rap1 effector during dorsal closure of the Drosophila embryo. Genetics 165, 159-169. - PMC - PubMed

Publication types

MeSH terms