. 2018 Mar 20;115(12):3066-3071.
doi: 10.1073/pnas.1717956115. Epub 2018 Mar 5.

Single-molecule analysis of phospholipid scrambling by TMEM16F

Affiliations

Single-molecule analysis of phospholipid scrambling by TMEM16F

Rikiya Watanabe et al. Proc Natl Acad Sci U S A. .

Abstract

Transmembrane protein 16F (TMEM16F) is a Ca2+-dependent phospholipid scramblase that translocates phospholipids bidirectionally between the leaflets of the plasma membrane. Phospholipid scrambling of TMEM16F causes exposure of phosphatidylserine in activated platelets to induce blood clotting and in differentiated osteoblasts to promote bone mineralization. Despite the importance of TMEM16F-mediated phospholipid scrambling in various biological reactions, the fundamental features of the scrambling reaction remain elusive due to technical difficulties in the preparation of a platform for assaying scramblase activity in vitro. Here, we established a method to express and purify mouse TMEM16F as a dimeric molecule by constructing a stable cell line and developed a microarray containing membrane bilayers with asymmetrically distributed phospholipids as a platform for single-molecule scramblase assays. The purified TMEM16F was integrated into the microarray, and monitoring of phospholipid translocation showed that a single TMEM16F molecule transported phospholipids nonspecifically between the membrane bilayers in a Ca2+-dependent manner. Thermodynamic analysis of the reaction indicated that TMEM16F transported 4.5 × 10⁴ lipids per second at 25 °C, with an activation free energy of 47 kJ/mol. These biophysical features were similar to those observed with channels, which transport substrates by facilitating diffusion, and supported the stepping-stone model for the TMEM16F phospholipid scramblase.

Keywords: TMEM16F; membrane protein; microsystem; phospholipid scrambling; single-molecule analysis.


Conflict of interest statement

The authors declare no conflict of interest.

Figures
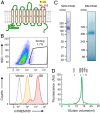
Fig. 1.
Fig. 1.
Transformants overexpressing TMEM16F and purified TMEM16F. (A) Schematic structure of the mTMEM16F structure. The fifth extracellular region used as an antigen to prepare mAbs against mTMEM16F is indicated in red. The numbers indicate the positions of the first and last amino acids of the fifth extracellular region. (B) Establishment of a Ba/F3 transformant overexpressing mTMEM16F by fluorescence-activated cell sorting (FACS). (Top) Original Ba/F3 transformants expressing mTMEM16F were stained with anti-mTMEM16F mAbs, and cells in the boxed area were collected using a FACSAria II. (Bottom) Cells sorted twice (S2) or eight times (S8) were stained with anti-mTMEM16F mAbs, and their staining profiles are shown, together with those of the Ba/F3 cells transformed by the empty vector. (C and D) Biochemical characterization of the purified mTMEM16F. The purified mTMEM16F was analyzed by SDS/PAGE and BN/PAGE (C) and gel filtration (D) using 1.5 μg, 2.9 μg, and 0.5 μg of protein, respectively. Proteins in SDS/PAGE and BN/PAGE were stained with Coomassie Brilliant Blue, whereas proteins in gel filtration were detected by intrinsic tryptophan fluorescence. Precision Plus Protein Standards (Bio-Rad) and NativeMark Unstained Protein Standards (Thermo Fisher Scientific) were used as molecular weight standards for SDS/PAGE and BN/PAGE, respectively, and their molecular weights are shown on the left. In gel filtration, thyroglobulin (669 kDa), ferritin (440 kDa), aldolase (158 kDa), and ovalbumin (44 kDa) were analyzed. AU, arbitrary unit.
Fig. 2.
Fig. 2.
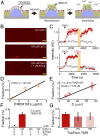
Microarray assay system for phospholipid scramblase. (A) Microchambers fabricated with CYTOP on a glass substrate. Each microchamber was filled with an aqueous solution (purple) and covered with phospholipid bilayers of POPC (gray) and fluorescent phospholipids (red). All other areas were covered by a monolayer of the same phospholipids, the fatty acids of which faced the hydrophobic CYTOP polymer. This monolayer was contiguous with the upper leaflets of bilayers deposited at the top of microchambers. (B) Procedures. (i) Membrane bilayers formed over microchambers were exposed for a few seconds to a laser to (ii) photobleach fluorescently labeled phospholipids (red). (iii) Fluorescent lipids diffused into the bilayer from the surrounding area, but were then restricted to the outer layer. (C) Confocal fluorescence images of microarrays. (Left) Maximum intensity projection (top) and cross-sectional (side) views of TopFluor-TMR-PS (red) before and after photobleaching are shown. (Right) Intensity profile of the fluorescence along the dashed lines in the top view before (red) and after (gray) photobleaching is shown. AU, arbitrary unit.
Fig. 3.
Fig. 3.
Phospholipid scrambling by a single TMEM16F molecule. (A) TMEM16F was incorporated into the asymmetrical membrane bilayers with fluorescent phospholipids (red). Addition of CaCl2 initiated phospholipid scrambling, followed by lateral diffusion of unbleached phospholipids from surrounding areas, increasing the fluorescence intensity in microchambers. (B) Purified TMEM16F was loaded at 3.4 μg/mL, and scrambling was initiated with 100 μM CaCl2. Subsequently, the asymmetrical membrane bilayers were again formed by laser irradiation, and the scambling was assayed by injecting 100 μM CaCl2 in the presence of 1 μM EGCg. Maximum intensity projections of confocal images of TopFluor-TMR-PS (red) obtained from the same microchambers before (Top) and after addition of 100 μM CaCl2 (Middle) or 100 μM CaCl2 + 1 μM EGCg (Bottom) are shown. (Scale bars: 5 μm.) AU, arbitrary unit. (C) Time course of TMEM16F-mediated phospholipid scrambling. Lipid bilayers with (red) or without (gray) TMEM16F were treated with 100 μM CaCl2 (black arrowheads), and fluorescence from TopFluor-TMR-PS was followed over time. Subsequently, the microchambers were reexposed for a few seconds to a laser at time points marked in orange, with (Bottom) or without (Top) prior injection of 1 μM EGCg (red arrowhead). (D) Microarrays with fluorescent TopFluor-TMR-PS in the outer layer were loaded with 0.7, 3.4, or 6.3 μg/mL TMEM16F in buffer containing 100 μM CaCl2. The percentage of chambers with scramblase activity was plotted as orange circles, with SDs as error bars. The black line is a linear regression. (E) Percentage of chambers with scramblase activity against the membrane area (S). Microarrays with TopFluor-TMR-PS were loaded with 3.4 μg/mL TMEM16F in buffer containing 100 μM CaCl2. The black line is the linear regression. (F) Percentage of microchambers with scramblase activity against the concentration of Ca2+ or inhibitors. Microarrays with TopFluor-TMR-PS were loaded with 3.4 μg/mL TMEM16F in a buffer containing the indicated concentrations of CaCl2 and inhibitors [EGCg and tannic acid (TA)]. (G) Percentage of chambers with scramblase activity against fluorescence substrates: TopFluor-TMR-PS (red), TopFluor-TMR-PC (light red), or TopFluor-TMR-PE (pink). Microarrays were loaded with 3.4 μg/mL TMEM16F in buffer containing 100 μM CaCl2.
Fig. 4.
Fig. 4.
Biophysical characterization of TMEM16F-mediated scrambling. (A) Area (S) of the bilayer membrane was calculated (Top) from 3D confocal fluorescence images (Middle). (Scale bar: 2.5 μm.) (Bottom) Microarrays with membrane bilayers of the indicated areas were loaded with (red) or without (gray) 3.4 μg/mL TMEM16F in a buffer containing 100 μM CaCl2, and TopFluor-TMR-PS was followed for the indicated times. Experiments were repeated 24–166 times, and average values from 389 to 20,280 microchambers are plotted with SDs. Black curves are fits to the single-exponential function y = C1 + C2 × (1 − exp[−k × (t − 1,000)]). AU, arbitrary unit; d, diameter of chamber. (B) Rate constant of fluorescence increase (k*) of TopFluor-TMR-PS was plotted against the inverse of membrane area (1/S). Data are from at least 380 microchambers in 16 independent experiments, and average values are shown as red circles with SDs. The black line is a linear regression. (C) Values of k determined at various lipid compositions: 0.3 mg/mL POPC with 0.001 mg/mL TopFluor-TMR-PS (red), TopFluor-TMR-PC (light red), or TopFluor-TMR-PE (pink); 0.24 mg/mL POPC; 0.03 mg/mL POPS; and 0.03 mg/mL liver PI with 0.001 mg/mL TopFluor-TMR-PS (orange).
Fig. 5.
Fig. 5.
Temperature dependence of TMEM16F-mediated scrambling. (A) Rate constant of fluorescence increase (k*) represented by orange, red, and blue circles was plotted against the inverse of the membrane area (1/S). Data in blue, red, and orange were obtained using TopFluor-TMR-PS at 16 °C, 25 °C, and 31 °C, respectively. Black lines are linear regressions. (B) Arrhenius plot for TMEM16F-mediated phospholipid scrambling, with k values from A (purple). The solid line represents linear regression. (Inset) Thermodynamic parameters at 25 °C, as determined from the plot.

References

    1. Leventis PA, Grinstein S. The distribution and function of phosphatidylserine in cellular membranes. Annu Rev Biophys. 2010;39:407–427. - PubMed
    1. Balasubramanian K, Schroit AJ. Aminophospholipid asymmetry: A matter of life and death. Annu Rev Physiol. 2003;65:701–734. - PubMed
    1. Segawa K, et al. Caspase-mediated cleavage of phospholipid flippase for apoptotic phosphatidylserine exposure. Science. 2014;344:1164–1168. - PubMed
    1. Segawa K, Nagata S. An apoptotic ‘eat me’ signal: Phosphatidylserine exposure. Trends Cell Biol. 2015;25:639–650. - PubMed
    1. Suzuki J, Umeda M, Sims PJ, Nagata S. Calcium-dependent phospholipid scrambling by TMEM16F. Nature. 2010;468:834–838. - PubMed

Publication types

LinkOut - more resources