. 2018 Mar 20;115(12):E2869-E2878.
doi: 10.1073/pnas.1711037115. Epub 2018 Mar 5.

Simultaneous imaging and functional studies reveal a tight correlation between calcium and actin networks

Affiliations

Simultaneous imaging and functional studies reveal a tight correlation between calcium and actin networks

Carlisle S Bascom Jr et al. Proc Natl Acad Sci U S A. .

Abstract

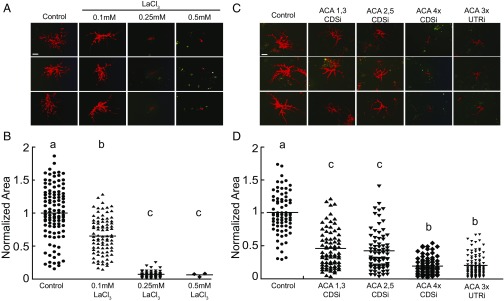
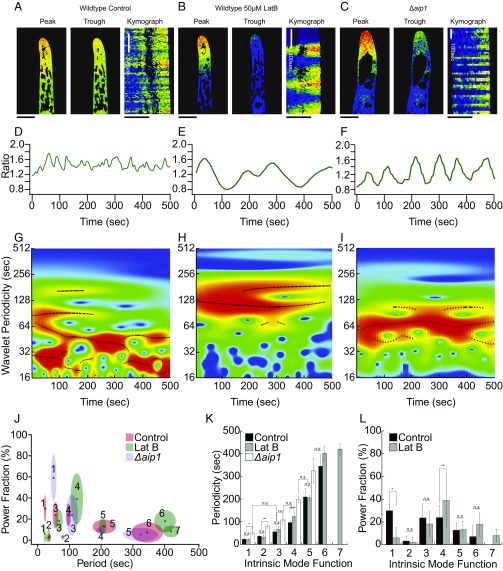
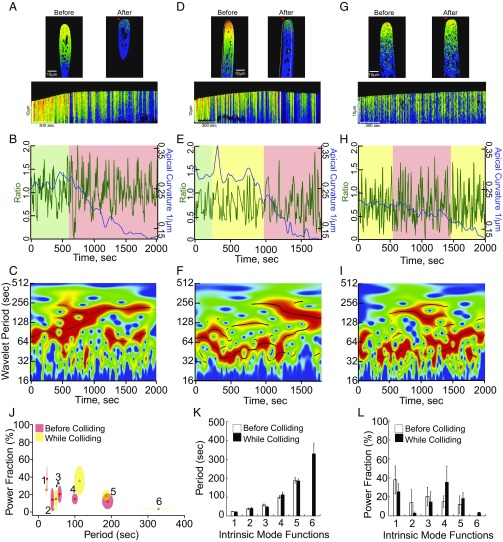
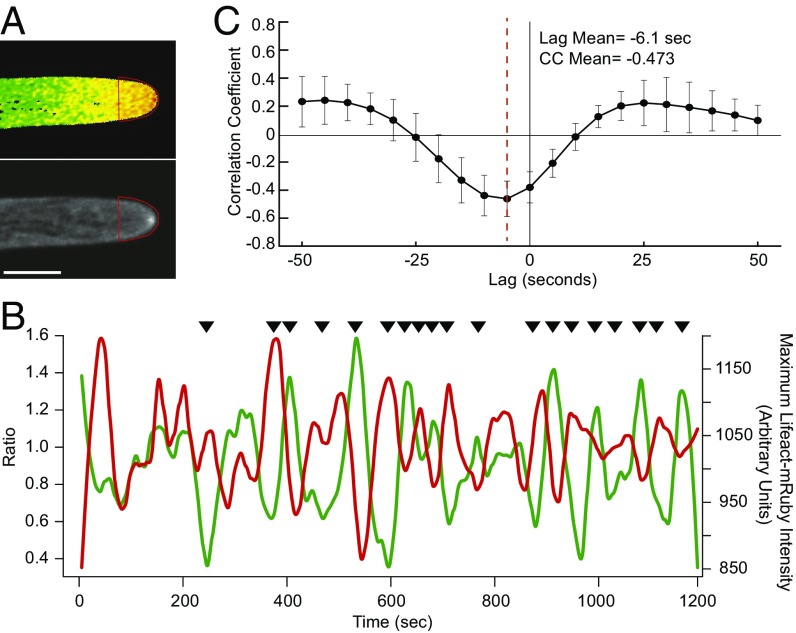
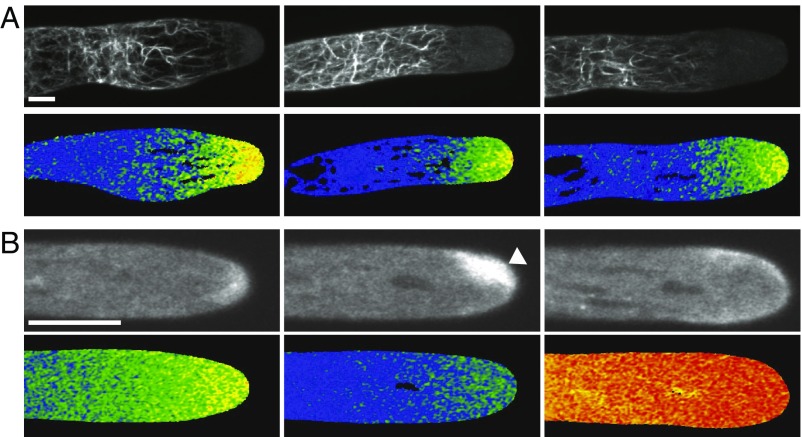
Tip-growing cells elongate in a highly polarized manner via focused secretion of flexible cell-wall material. Calcium has been implicated as a vital factor in regulating the deposition of cell-wall material. However, deciphering the molecular and mechanistic calcium targets in vivo has remained challenging. Here, we investigated intracellular calcium dynamics in the moss Physcomitrella patens, which provides a system with an abundant source of genetically identical tip-growing cells, excellent cytology, and a large molecular genetic tool kit. To visualize calcium we used a genetically encoded cytosolic FRET probe, revealing a fluctuating tipward gradient with a complex oscillatory profile. Wavelet analysis coupled with a signal-sifting algorithm enabled the quantitative comparison of the calcium behavior in cells where growth was inhibited mechanically, pharmacologically, or genetically. We found that cells with suppressed growth have calcium oscillatory profiles with longer frequencies, suggesting that there is a feedback between the calcium gradient and growth. To investigate the mechanistic basis for this feedback we simultaneously imaged cytosolic calcium and actin, which has been shown to be essential for tip growth. We found that high cytosolic calcium promotes disassembly of a tip-focused actin spot, while low calcium promotes assembly. In support of this, abolishing the calcium gradient resulted in dramatic actin accumulation at the tip. Together these data demonstrate that tipward calcium is quantitatively linked to actin accumulation in vivo and that the moss P. patens provides a powerful system to uncover mechanistic links between calcium, actin, and growth.

Keywords: actin; calcium; tip growth.


Conflict of interest statement

The authors declare no conflict of interest.

Figures

Fig. 1.
Fig. 1.
Calcium-channel inhibition inhibits protonemal growth. Representative fluorescence images of 7-d-old plants (A) and the quantification of plant size (B) grown on the indicated concentration of LaCl3. Representative 7-d-old plants transformed with the indicated constructs (C) and the quantification of plant size (D). Plants were visualized by imaging chloroplast autofluorescence with a fluorescence stereomicroscope. Plant area was determined by measuring the area of the chlorophyll autofluorescence, normalized to control conditions. Letters indicate statistical groups with α < 0.05 from an ANOVA analysis. (Scale bars, 100 μm.)
Fig. 2.
Fig. 2.
Visualization of tipward calcium gradient in protonemata. Representative images from a time-lapse acquisition showing the peak and trough of the calcium fluctuations in WT (A), 50 μM LatB-treated WT (B), and Δaip1 (C) cells (Movie S1). (Scale bars, 10 μm.) Kymographs are made from a 20-μm line drawn through the middle of the cell, parallel to the access of growth. Line traces of mean intensity in an apical region ROI for WT (D), LatB-treated WT (E), and Δaip1 (F) cells. Wavelet analysis output represented as a heat map, from WT (G), LatB-treated WT (H), and Δaip1 (I) cells. Black lines are ridges of statistically significant oscillations. (J) Period–power fraction plot of IMFs in each treatment. Size of ellipse is SD on each axis. (K) Period plot of each IMF. Stars denote statistical difference (Fisher’s LSD, P < 0.05). (L) Power fraction plot for each IMF in control and LatB-treated cells. Power of the IMFs shifts to favor longer periods, specifically IMF4 (Fisher’s LSD, P < 0.05).
Fig. 3.
Fig. 3.
The tipward calcium oscillations were altered by inhibiting growth mechanically. (A, D, and G) Representative images and kymographs from a time-lapse acquisition of cells interacting with barriers. Deformed tips denoted by red arrows. White outline marks the cell’s initial position before it translocated along the barrier. (B, E, and H) YCN ratio trace (green line) and apical curvature (blue line); note that apical curvature decreases as a function of tip deformation. Green denotes time period before collision, yellow denotes time period when cell exhibits intermediate expansion rates, and red denotes time period when cell exhibits minimal expansion rates. (C, F, and I) Wavelet analysis showing a shift to favor long periods after maximal decrease in expansion rate (Fig. S3). (J) Period–power fraction plot of IMFs obtained from the green/yellow regions of traces before the maximal collision state (red regions). Size of ellipse denotes SD on each axis. (K) Period of each IMF before and during impact, showing that period length is unaffected. (L) Power fraction of each IMF shows a trend to favor IMF4 upon impact.
Fig. 4.
Fig. 4.
Actin and calcium are anticorrelated at the tip of growing cells. (A) Images of YCN and Lifeact-mRuby acquired simultaneously. Red trace depicts the ROI used for analysis (Movie S3). (Scale bar, 10 μm.) (B) Intensity plot of mean YCN intensity within the ROI (green) and maximum Lifeact-mRuby intensity within the ROI (red). Black arrows indicate qualitative regions of anticorrelation. (C) Cross-correlation average trace (n = 9 cells) revealing a maximum correlation coefficient and lag between calcium and actin.
Fig. 5.
Fig. 5.
Aberrant actin and calcium. (A) Maximum intensity projections of Z-stacks (Top) of Lifeact-mRuby and medial plane selections of YCN (Bottom) from three representative YCN/LA/Δaip1 apical cells. Note that the basal end of the calcium gradient coincides with the apical limit of the actin bundles (Movie S4). (B) Single-focal-plane images of Lifeact-mRuby (Top) and YCN (Bottom) from a cell treated with 0.1 mM LaCl3. The first pair is pretreatment, the second pair shows the accumulated apical actin the absence of cytosolic calcium (white arrow), and the third pair shows the abolishing of accumulated apical actin after rupture (Movie S5). (Scale bars, 10 µm.)

References

    1. Hepler PK. Calcium: A central regulator of plant growth and development. Plant Cell. 2005;17:2142–2155. - PMC - PubMed
    1. Monshausen GB, Messerli MA, Gilroy S. Imaging of the Yellow Cameleon 3.6 indicator reveals that elevations in cytosolic Ca2+ follow oscillating increases in growth in root hairs of Arabidopsis. Plant Physiol. 2008;147:1690–1698. - PMC - PubMed
    1. Bibikova TN, Zhigilei A, Gilroy S. Root hair growth in Arabidopsis thaliana is directed by calcium and an endogenous polarity. Planta. 1997;203:495–505. - PubMed
    1. Wang YF, Fan LM, Zhang WZ, Zhang W, Wu WH. Ca2+-permeable channels in the plasma membrane of Arabidopsis pollen are regulated by actin microfilaments. Plant Physiol. 2004;136:3892–3904. - PMC - PubMed
    1. Malho R, Trewavas AJ. Localized apical increases of cytosolic free calcium control pollen tube orientation. Plant Cell. 1996;8:1935–1949. - PMC - PubMed

Publication types

LinkOut - more resources