. 2018 Mar 20;115(12):3078-3083.
doi: 10.1073/pnas.1721159115. Epub 2018 Mar 5.

The seasonality of nonpolio enteroviruses in the United States: Patterns and drivers

Affiliations

The seasonality of nonpolio enteroviruses in the United States: Patterns and drivers

Margarita Pons-Salort et al. Proc Natl Acad Sci U S A. .

Abstract

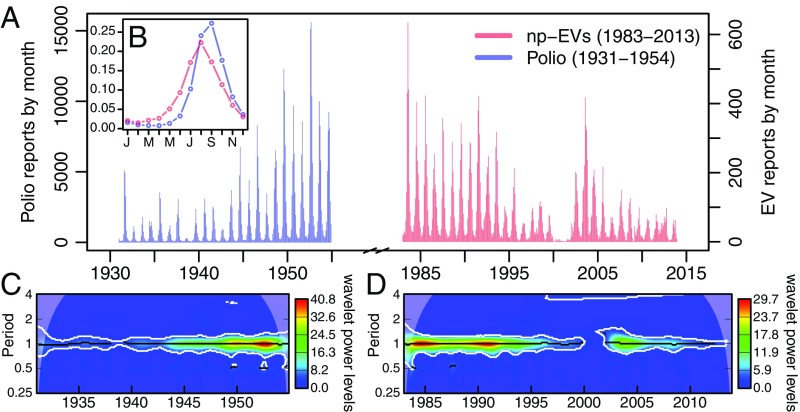
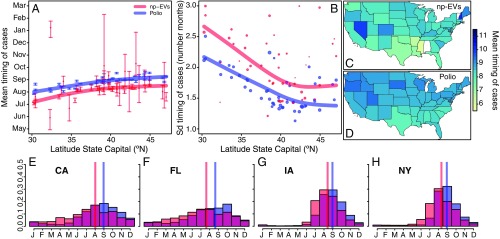
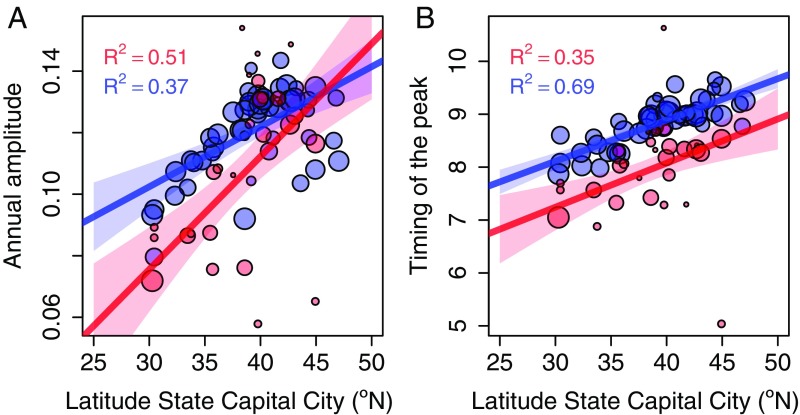
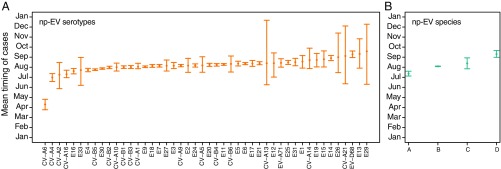
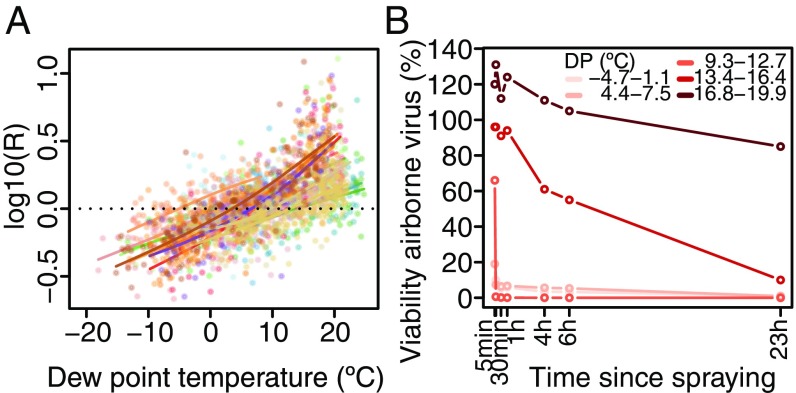
Nonpolio enteroviruses are diverse and common viruses that can circulate year-round but tend to peak in summer. Although most infections are asymptomatic, they can result in a wide range of neurological and other diseases. Many serotypes circulate every year, and different serotypes predominate in different years, but the drivers of their geographical and temporal dynamics are not understood. We use national enterovirus surveillance data collected by the US Centers for Disease Control and Prevention during 1983-2013, as well as demographic and climatic data for the same period, to study the patterns and drivers of the seasonality of these infections. We find that the seasonal pattern of enterovirus cases is spatially structured in the United States and similar to that observed for historical prevaccination poliomyelitis (1931-1954). We identify latitudinal gradients for the amplitude and the timing of the peak of cases, meaning that those are more regularly distributed all year-round in the south and have a more pronounced peak that arrives later toward the north. The peak is estimated to occur between July and September across the United States, and 1 month earlier than that for historical poliomyelitis. Using mixed-effects models, we find that climate, but not demography, is likely to drive the seasonal pattern of enterovirus cases and that the dew point temperature alone explains ∼30% of the variation in the intensity of transmission. Our study contributes to a better understanding of the epidemiology of enteroviruses, demonstrates important similarities in their circulation dynamics with polioviruses, and identifies potential drivers of their seasonality.

Keywords: United States; climate; enterovirus; poliomyelitis; seasonality.


Conflict of interest statement

The authors declare no conflict of interest.

Figures

Fig. 1.
Fig. 1.
Annual summer seasonality of nonpolio enterovirus and historical poliomyelitis cases in the United States. (A) Time series of the monthly number of nonpolio enterovirus cases (np-EVs; red) and poliomyelitis cases (Polio; blue) in the United States during the periods 1983–2013 and 1931–1954, respectively. (B, shown as Inset) Average monthly distribution of cases within the year for nonpolio enterovirus (red) and poliomyelitis (blue) based on all cases reported. (C and D) Average wavelet power of the two time series in A: poliomyelitis (C) and nonpolio enteroviruses (D).
Fig. 2.
Fig. 2.
Description of the monthly distribution of cases within the year per state. (A) Mean timing of cases of nonpolio enterovirus (np-EVs; red) and poliomyelitis (Polio; blue) per state as a function of the latitude of its capital city. The 95% CIs of the mean were obtained by bootstrapping 1,000 times. (B) SD of the timing of cases per state as a function of the latitude of its capital city. In A and B, the lines are cubic splines weighted by the total number of cases reported in each state. The size of the points in B indicates the number of total cases in each state. A sensitivity analysis of A and B data using the latitude of the state’s center of population showed a similar pattern (SI Appendix, Fig. S5). (C and D) US maps showing the mean timing of cases per state. (EH) Monthly distribution of cases of enterovirus (red) and poliomyelitis (blue) within the year in four different states: California (CA), Florida (FL), Iowa (IA), and New York (NY). In EH, the vertical lines indicate the estimated mean timing of cases in each state.
Fig. 3.
Fig. 3.
Latitudinal gradients in the seasonal pattern of nonpolio enterovirus (red) and poliomyelitis (blue) cases. (A) Gradients for the annual amplitude. (B) Gradients for the timing of the peak. The dots are mean values per state of the seasonal characteristics (amplitude and timing of the peak) weighted by the number of cases informing that value each year. The size of the dots indicates the number of years informing the mean value of each state. The lines are the estimated linear regressions weighted by the number of years informing each value, and the shades are the 95% CIs of the estimated linear regression by minimizing the least squares. A sensitivity analysis of A and B data using the latitude of the state’s center of population showed a similar pattern (SI Appendix, Fig. S4).
Fig. 4.
Fig. 4.
Mean timing of cases by nonpolio enterovirus (np-EV) serotype (A) and species (B) with their 95% CIs.
Fig. 5.
Fig. 5.
Dew point temperature and intensity of transmission. (A) Monthly estimates of the case reproduction number (log10) against monthly mean of dew point. Each color corresponds to a state. The lines are cubic splines for the observations of each state. (B) Effect of dew point (DP) on poliovirus survival. Experimental studies conducted in the early 1960s studied the influence of relative humidity on the survival of poliovirus in aerosols (15). We used data in ref. and an approximation of the dew point based on temperature, relative humidity, and pressure to look at those results for different values of the dew point. This approximation was based on the so-called Magnus formula (39), accounting for an improvement of the saturation water vapor pressure in ref. and using the constants in ref. . The lower and upper bounds of the intervals for the dew point were computed using the lower and upper values reported for temperature and relative humidity.

Similar articles

Cited by

References

    1. Pallansch MA, et al. Enteroviruses: Polioviruses, coxsackieviruses, echoviruses, and newer enteroviruses. In: Knipe DM, Howley P, editors. Fields Virology. 6th Ed. Vol 2. Lippincott Williams & Wilkins; Philadelphia: 2013. pp. 490–530.
    1. Martin NG, et al. Hospital admissions for viral meningitis in children in England over five decades: A population-based observational study. Lancet Infect Dis. 2016;16:1279–1287. - PubMed
    1. Rao CD, Yergolkar P, Shankarappa KS. Antigenic diversity of enteroviruses associated with nonpolio acute flaccid paralysis, India, 2007-2009. Emerg Infect Dis. 2012;18:1833–1840. - PMC - PubMed
    1. Global Polio Eradication Initiative 2013 Fact File: Polio eradication and endgame strategic plan 2013–2018. Available at polioeradication.org/wp-content/uploads/2016/07/PEESP_EN_A4.pdf. Accessed March 27, 2017.
    1. Xing W, et al. Hand, foot, and mouth disease in China, 2008-12: An epidemiological study. Lancet Infect Dis. 2014;14:308–318. - PMC - PubMed

Publication types