. 2018 Mar 20;115(12):E2829-E2838.
doi: 10.1073/pnas.1719827115. Epub 2018 Mar 5.

Communicating the nutritional value of sugar in Drosophila

Affiliations

Communicating the nutritional value of sugar in Drosophila

Farhan Abu et al. Proc Natl Acad Sci U S A. .

Abstract

Sweet-insensitive Drosophila mutants are unable to readily identify sugar. In presence of wild-type (WT) flies, however, these mutant flies demonstrated a marked increase in their preference for nutritive sugar. Real-time recordings of starved WT flies revealed that these flies discharge a drop from their gut end after consuming nutritive sugars, but not nonnutritive sugars. We proposed that the drop may contain a molecule(s) named calorie-induced secreted factor (CIF), which serves as a signal to inform other flies about its nutritional value. Consistent with this, we observed a robust preference of flies for nutritive sugar containing CIF over nutritive sugar without CIF. Feeding appears to be a prerequisite for the release of CIF, given that fed flies did not produce it. Additionally, correlation analyses and pharmacological approaches suggest that the nutritional value, rather than the taste, of the consumed sugar correlates strongly with the amount (or intensity) of the released CIF. We observed that the release of this attractant signal requires the consumption of macronutrients, specifically nutritive sugars and l-enantiomer essential amino acids (l-eAAs), but it is negligibly released when flies are fed nonnutritive sugars, unnatural d-enantiomer essential amino acids (d-eAAs), fatty acids, alcohol, or salts. Finally, CIF (i) is not detected by the olfactory system, (ii) is not influenced by the sex of the fly, and (iii) is not limited to one species of Drosophila.

Keywords: CIF; aggregation pheromone; communication; nutritive sugar; sweet-insensitive mutant.


Conflict of interest statement

The authors declare no conflict of interest.

Figures

Fig. 1.
Fig. 1.
WT flies guide sweet-insensitive mutants to locate nutritive sugar. (A) Schematic drawing of the two-choice foraging assay: 100 mM d-glucose + 1% agar versus 1% agar alone. Thirty male flies starved for 24 h, unless otherwise stated, were introduced into the arena at room temperature (∼23 °C) in the dark, and their preferences were scored after 2 h. (B) Preference of 24 h-starved ∆Gr5a;Gr64a, poxnΔM22-B5 (poxn) mutants, and WT CS flies in the two-choice assay. Asterisks indicate significant differences from WT (one-way ANOVA, followed by a Bonferroni test; n = 12). glu, glucose. (C) Preference of 20 starved ∆Gr5a;Gr64a or poxnΔM22-B5 responders when mixed with a varying number of starved WT emitters. Asterisks indicate significant differences from the control groups, where no WT flies were mixed (nonparametric Student’s t test, followed by a Mann–Whitney U test; n = 12). (D) Preference of 30 starved ∆Gr5a;Gr64a or poxnΔM22-B5 responders in the two-choice arena: preexposed to starved WT emitters either fed or starved for 24 h. CSX1 and CSX3 indicate one round and three rounds of preexposure, respectively, with starved WT flies in the arena for 2 h. Asterisks indicate significant differences from the control group when the arena was not preexposed to WT flies (one-way ANOVA, followed by a Bonferroni test; n = 12). *P < 0.05; **P < 0.01; ***P < 0.001; ****P < 0.0001. Error bars indicate SEM.
Fig. 2.
Fig. 2.
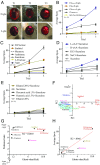
Release of the signal is specific to sugar and l-eAAs and is highly correlated with their caloric value. (A) Representative photographs of spots produced by 30 starved WT flies after feeding in a two-choice arena: d-glucose (d-glu)+agar or l-glucose(l-glu)+agar versus agar alone for 2 h [trial 1 (T1)]. T2 and T3 refer to second and third additional 2-h exposures to new sets of 30 starved WT flies. (B) Average number of spots produced around agar containing d-glu or l-glu by WT flies, ∆Gr5a;Gr64a mutants, and poxnΔM22-B5 mutants, either fed (0 h) or starved (24 h) (n = 12). (C) Average number of spots produced by 30 starved WT flies in a two-choice arena containing one of the following sugars (d-fructose, d-sorbitol, l-fructose, arabinose, mannose, or sucralose)+agar versus agar alone. The concentration of these sugars was 100 mM, except sucralose (0.5 mM) (n = 12). (D) Average number of spots produced by 30 starved WT flies in a two-choice arena containing l-eAAs or d-eAAs+sucralose+agar versus agar alone, and 0.3 M NaCl or KCl+sucralose+agar versus agar alone. As a control, sucralose+agar versus agar alone was used (n = 12). (E) Average number of spots produced by 30 starved WT flies in a two-choice arena containing ethanol+agar+sucralose versus agar, and hexanoic or octanoic acid+agar+sucralose versus agar. Sucralose+agar versus agar alone was used as a control (n = 12). (F) PCA analysis plotting the distribution of spot production around different macronutrients. Clusters are based on the number of spots produced by flies correlated to the caloric value of corresponding macronutrients. PC1, principal component 1. (G) Linear correlation of PI to the caloric value of different sugars used (n = 12). (H) Linear correlation of spots produced to the caloric value of different sugars used (n = 12). Error bars indicate SEM.
Fig. 3.
Fig. 3.
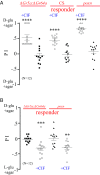
Deposition around nutritive sugars triggers an attractive response. (A) Preference of starved ∆Gr5a;Gr64a, poxnΔM22-B5 (poxn), and WT responders in a two-choice assay: d-glucose (d-glu)+agar with spots versus d-glu+agar without CIF. As a control, flies were given a choice between d-glu+agar without CIF and d-gluc+agar without CIF. Asterisks indicate significant differences from the control group without CIF (nonparametric Student’s t test, followed by a Mann–Whitney U test; n = 12). (B) Preference of starved ∆Gr5a;Gr64a or poxn mutants in a two-choice assay, l-glu+agar with CIF versus d-glu+agar without CIF. Asterisks indicate significant differences from the control group without CIF (nonparametric Student’s t test, followed by a Mann–Whitney U test; n = 12). **P < 0.01; ***P < 0.001; ****P < 0.0001. Error bars indicate SEM.
Fig. 4.
Fig. 4.
Caloric value of sugar is important for signal release. (A) Preference of 20 starved ∆Gr5a;Gr64a or poxnΔM22-B5 (poxn) responders when mixed with 10 starved WT emitters in a two-choice assay: l-glucose (l-glu) +agar versus agar alone. ns, nonsignificant differences from the control group, where no WT flies were mixed (nonparametric Student’s t test, followed by a Mann–Whitney U test; n = 12). (B) Preference of 30 starved ∆Gr5a;Gr64a or poxn responders in a two-choice assay: d-glu or l-glu (shaded area)+agar versus agar alone. The two-choice arena was previously preexposed to starved WT emitters for 2 h for three rounds or was not preexposed. Asterisks indicate significant differences from the control group when not preexposed to WT emitters (one-way ANOVA, followed by a Bonferroni test; n = 12). (C) Average number of spots produced by 30 starved WT flies in a two-choice arena containing d-glu+agar with or without phlorizin versus agar alone, d-fructose (d-fru)+agar with or without phlorizin versus agar alone, mannose+agar with or without sucralose versus agar alone, and mannose+agar versus agar alone. (D) PCA analysis plotting the distribution after adding phlorizin to d-glu or d-fru and adding mannose to sucralose. Clusters are based on the number of spots produced by flies correlated to the caloric value of consumed sugar. (E) Preference of 20 starved ∆Gr5a;Gr64a or poxn responders when mixed with 10 starved WT emitters in a two-choice assay: d-glu+agar with (shaded area) or without phlorizin versus agar alone. Asterisks indicate a significant difference from the control group when no WT flies were mixed (one-way ANOVA, followed by a Bonferroni test; n = 12). (F) Preference of 20 starved ∆Gr5a;Gr64a or poxn responders when mixed with 10 starved WT emitters in a two-choice assay: d-fructose (d-fruc)+agar with (shaded area) or without phlorizin versus agar alone. ns, nonsignificant differences from the control group, where no WT flies were mixed. Asterisks indicate significant differences from the preference for d-glu+agar (one-way ANOVA, followed by a Bonferroni test; n = 10–12). *P < 0.05; **P < 0.01. Error bars indicate SEM.
Fig. 5.
Fig. 5.
Olfactory system is not required for signal detection. (A) Preference of 20 starved, ∆Gr5a;Gr64a or poxnΔM22-B5 (poxn) responders in which the antennae (AL), palp (PL), or both (A&PL) were removed when mixed with 10 WT emitters in the two-choice assay: d-glucose(d-glu)+agar and agar alone. Asterisks indicate significant differences from the control group, where no WT flies were mixed (one-way ANOVA, followed by a Bonferroni test; n = 12). (B) Preference of 30 starved surgically amputated ∆Gr5a;Gr64a or poxn responders in a two-choice arena preexposed to starved WT emitters. Asterisks indicate significant differences from the control group when not preexposed to WT flies (one-way ANOVA, followed by a Bonferroni test; n = 12). (C) Preference of 30 starved surgically amputated WT responders in a two-choice assay: d-glu+agar with CIF versus d-glu+agar without CIF. The preference of Orco2 and IR8a;IR25a mutants as responders in a two-choice assay, d-glu+agar with spots versus d-gluc+agar without spots, is shown. As a control, Orco2 or IR8a;IR25a mutants were given a choice between d-glu+agar without CIF and d-glu+agar without CIF. Asterisks indicate significant differences from the control group without CIF (one-way ANOVA, followed by a Bonferroni test, and nonparametric Student’s t test, followed by a Mann–Whitney U test for Orco2 mutant; n = 6–12). *P < 0.05; **P < 0.01; ***P < 0.001; ****P < 0.0001. Error bars indicate SEM.
Fig. 6.
Fig. 6.
Signal is not sex-biased. (A) Preference of 20 starved male ∆Gr5a;Gr64a or poxnΔM22-B5 (poxn) responders when mixed with 10 starved WT emitters, either male or female, in the two-choice assay. Asterisks indicate significant differences from the control group, where no WT flies were mixed (one-way ANOVA, followed by a Bonferroni test; n = 12). (B) Preference of 20 starved female ∆Gr5a;Gr64a or poxn responders when mixed with 10 starved WT emitters, either female or male, in the two-choice assay. Asterisks indicate significant differences from the control group, where no WT flies were mixed (one-way ANOVA, followed by a Bonferroni test; n = 12). (C) Average number of spots produced by 30 starved WT male or female flies in the two-choice arena. Trial 2 and trial 3 refer to second and third additional 2-h exposures to new sets of 30 starved WT flies (n = 12). *P < 0.05; **P < 0.01. Error bars indicate SEM. d-glu, d-glucose.
Fig. 7.
Fig. 7.
Signal released by D. melanogaster promotes aggregation in some Drosophila species and vice versa. (A) Phylogenetic relationship of the Drosophila species. (B) Preference of starved ∆Gr5a;Gr64a or poxnΔM22-B5 (poxn) responders (20 flies) when mixed with other Drosophila species as emitters (D. simulans, D. erecta, and D. mojavensis; n = 10) in the two-choice assay. Asterisks indicates significant differences from the control group, where no other flies were mixed (one-way ANOVA, followed by a Bonferroni test; n = 12). (C) Preference of 30 starved ∆Gr5a;Gr64a or poxn responders in the two-choice arena preexposed to D. simulans, D. erecta, or D. mojavensis emitters for three rounds of 2 h of foraging. Asterisks indicate significant differences from the control group when not preexposed to any emitters (one-way ANOVA, followed by a Bonferroni test; n = 12). (D) Preference of 30 D. simulans, D. erecta, and D. mojavensis responders in a two-choice assay: CIF (produced by D. melanogaster) + d-glu(d-glu)+agar versus d-glu+agar. As a control, flies were given a choice between d-glu+agar without CIF and d-glu+agar without CIF. Asterisks indicate significant differences from the control group when not preexposed to other flies (one-way ANOVA, followed by a Bonferroni test; n = 12). *P < 0.05; **P < 0.01; ***P < 0.001. Error bars indicate SEM. (E) Summary diagram for communication of the nutritional value of food through CIF among flies. Upon the consumption of nutritional food, flies secrete CIF that attracts other flies to the food source.

Similar articles

Cited by

References

    1. Caccamise D, Reed L, Stouffer P. Roosting behavior and group territoriality in American crows. Auk. 1997;114:628–637.
    1. Seeley TD, Visscher PK, Passino KM. Group decision making in honey bee swarms. Am Sci. 2006;94:220–229.
    1. Riley JR, Greggers U, Smith AD, Reynolds DR, Menzel R. The flight paths of honeybees recruited by the waggle dance. Nature. 2005;435:205–207. - PubMed
    1. Wilson EO. Chemical communication among workers of the fire ant Solenopsis saevissima (Fr. Smith) 3. The experimental induction of social responses. Anim Behav. 1962;10:159–164.
    1. Bartelt RJ, Schaner AM, Jackson LL. cis-Vaccenyl acetate as an aggregation pheromone in Drosophila melanogaster. J Chem Ecol. 1985;11:1747–1756. - PubMed

Publication types

MeSH terms

LinkOut - more resources