. 2018 Mar 5;9(1):944.
doi: 10.1038/s41467-018-03375-w.

Life times of metastable states guide regulatory signaling in transcriptional riboswitches

Affiliations

Life times of metastable states guide regulatory signaling in transcriptional riboswitches

Christina Helmling et al. Nat Commun. .

Abstract

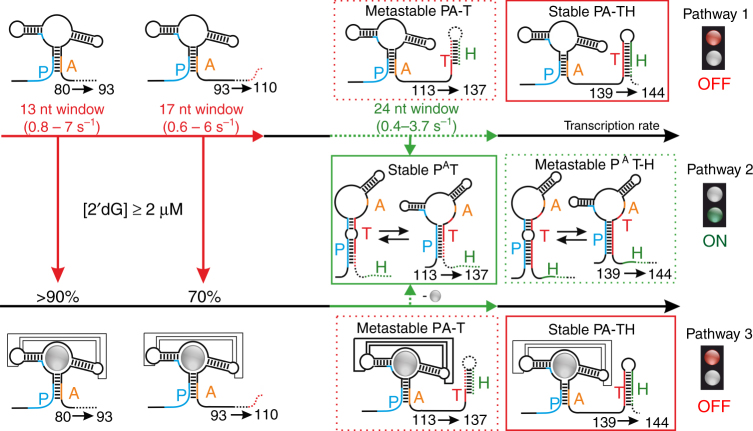
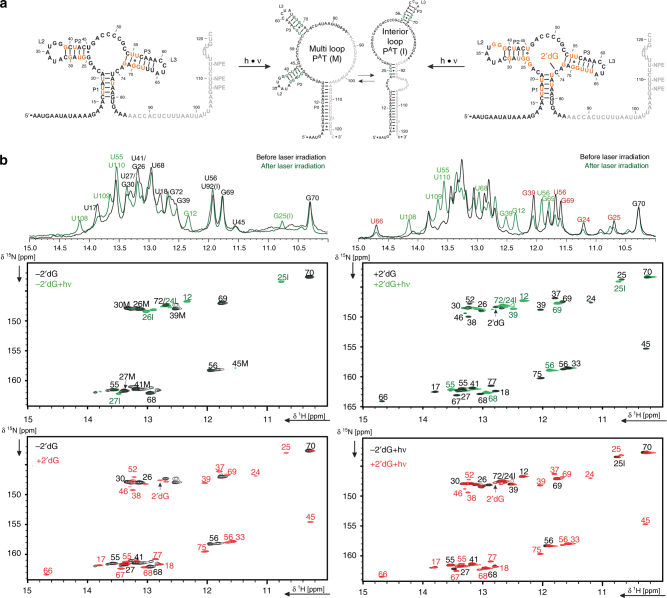
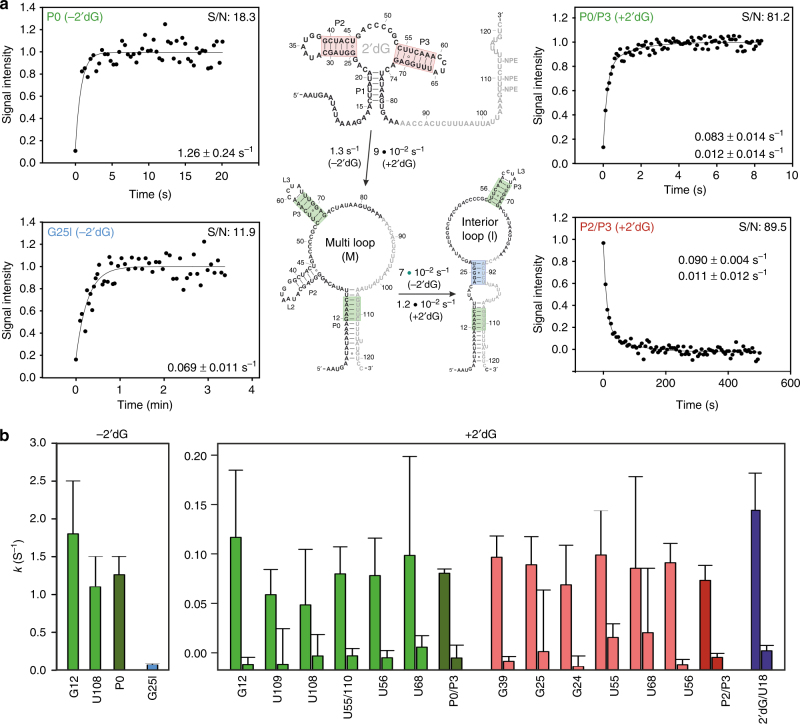
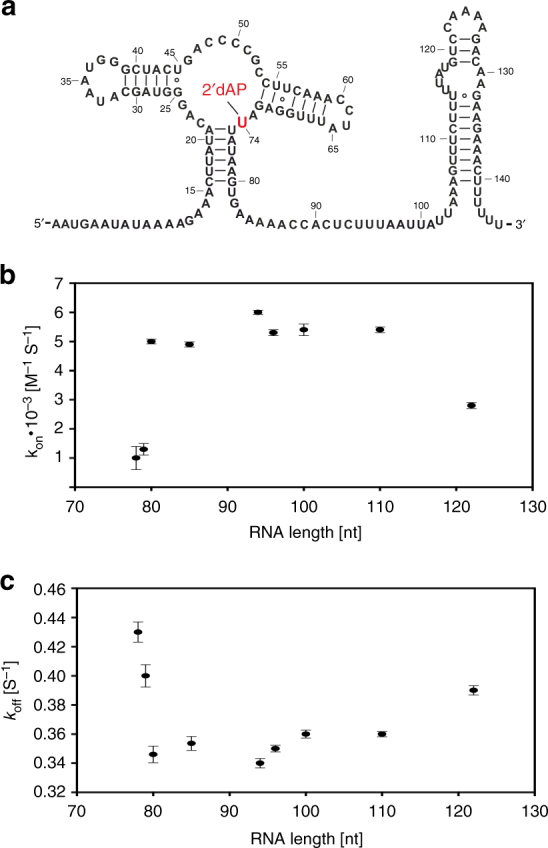
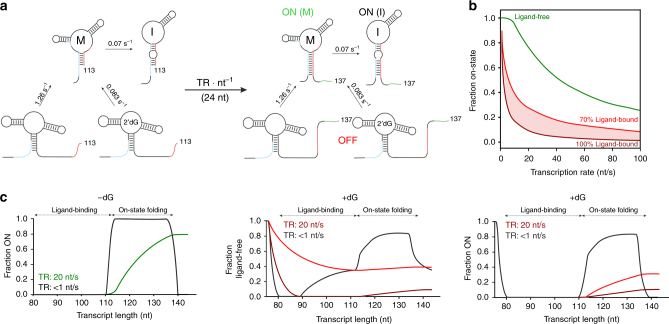
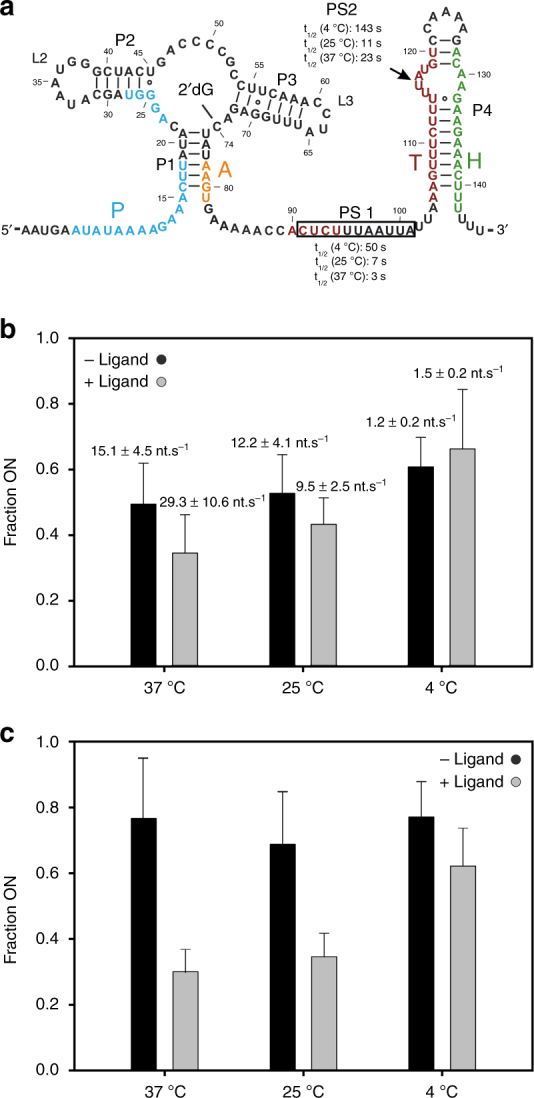
Transcriptional riboswitches modulate downstream gene expression by a tight coupling of ligand-dependent RNA folding kinetics with the rate of transcription. RNA folding pathways leading to functional ON and OFF regulation involve the formation of metastable states within well-defined sequence intervals during transcription. The kinetic requirements for the formation and preservation of these metastable states in the context of transcription remain unresolved. Here, we reversibly trap the previously defined regulatory relevant metastable intermediate of the Mesoplasma florum 2'-deoxyguanosine (2'dG)-sensing riboswitch using a photocaging-ligation approach, and monitor folding to its native state by real-time NMR in both presence and absence of ligand. We further determine transcription rates for two different bacterial RNA polymerases. Our results reveal that the riboswitch functions only at transcription rates typical for bacterial polymerases (10-50 nt s-1) and that gene expression is modulated by 40-50% only, while subtle differences in folding rates guide population ratios within the structural ensemble to a specific regulatory outcome.


Conflict of interest statement

The authors declare no competing interests.

Figures

Fig. 1
Fig. 1
Non-equilibrium model for the co-transcriptional conformational switch of the 2′dG-sensing riboswitch. Regulatory function by transcriptional riboswitches is based on a ligand-dependent interplay between the four sequence segments P (5′-aptamer strand), A (aptamer-stabilizing strand), T (switching strand), and H (terminator strand). Previously derived transcription intervals for folding events involving a stabilization of the aptamer domain via the P–A interaction or switch in strand interaction (A–T interaction) are highlighted in red (ligand binding) and green (ON state folding), respectively. Directly after transcription of the aptamer domain, 2′dG can bind during the synthesis of nts 80–110 (30 nt window), with a continuous decrease in the ligand binding efficiency from >90% to 70% between nucleotides 93 and 110. Continuation of transcription beyond nt 113 transforms both the ligand-bound and ligand-free aptamer domains (PA–T) into metastable states (dashed red box). Folding to the regulatory ON state (PAT, solid green box) can only occur during synthesis of nucleotides 113–137. At the regulatory decision point, folded PAT–H states are metastable (dashed green box), while the PA–TH conformation (solid red box) represents the lowest free energy state in both absence and presence of ligand. Metastable states are highlighted by dashed boxes and lowest free energy states by solid boxes
Fig. 2
Fig. 2
Structural integrity of caged dGsw121 before and after laser irradiation. a Secondary structures of dGsw121 in presence and absence of ligand, before photolysis (PA–T) and after photolysis to form the antiterminator conformations PAT(M) and PAT(I). Aptamer domain imino protons detectable by NMR are highlighted in orange. Antiterminator imino protons detectable by NMR are highlighted in green. b Overlay of 1D NMR spectra of caged dGsw121 before (black) and after (green) laser irradiation in absence (left) and presence (right) of 2 eq. of ligand  and combinations of overlay of 1H,15N -TROSY of dGsw121 in absence (−2′dG) or presence of 2 eq. ligand ( + 2′dG), and before and after ( + hν) laser irradiation. The spectra were recorded on 100 µM NMR samples with 6 eq. of Mg2+ at 800 MHz and 298 K. Characteristic imino proton signals to monitor the formation of PAT are highlighted in green. Characteristic imino proton signals to monitor aptamer dissociation in the presence of ligand are highlighted in red
Fig. 3
Fig. 3
Kinetic traces for ON state folding. a Averaged kinetic traces for antiterminator PAT(M) formation in presence and absence of ligand (green), kinetic trace for antiterminator PAT(I) formation derived from the imino proton reporter signal G25I (blue), and averaged kinetic trace for aptamer dissociation in the presence of ligand (red). Dissociation and association of helical segments monitored by real-time NMR are color coded accordingly in the secondary structure depiction on the right. b Individual rates derived from transients shown in (a) and Supplementary Fig. 3. Green bars indicate rates of P0 and P3 formation in PAT(I) and PAT(M) conformations, with the dark green bar corresponding to averaged rates for complete helix formation. The blue bar shows kinetic rates for PAT(I) formation only. Red bars correspond to helix P2 and P3 dissociation in the ligand-bound state and dark red to the averaged dissociation of helix P2 and P3. The purple bar corresponds to cooperative dissociation of both the ligand 2′dG and U18 (P1). Errors correspond to the s.d. of the fit. S/N values shown correspond to the S/N ratio of the latest data point
Fig. 4
Fig. 4
Ligand binding kinetics. a Secondary structure of dGswC74U highlighting the C to U mutation at position 74 in red to accommodate the fluorescence ligand analog 2-aminopurine-2′deoxyriboside (2′dAP). b Final kon and c koff rates of 2′dAP binding to dGswC74U derived from data shown in Supplementary Fig. 4 and Table 3 at varying transcript lengths. Errors correspond to the s.d. of the fit
Fig. 5
Fig. 5
Simulations of co-transcriptional folding. a Schematic representation of interconverting transcriptional intermediates between transcript lengths 113 and 137 nt and corresponding refolding rates derived from real-time NMR experiments. b Fraction of ON state obtained at nucleotide 137 depending on the transcription rate. Individual simulations were performed for interconverting transcriptional intermediates between transcript lengths 113 and 137 nt based on interconversion rates derived from real-time NMR experiments. The following three instances were simulated: the ligand is not bound to the aptamer domain before nucleotide 113 is synthesized (ligand-free, green); ligand binding is completed by 70% (70% ligand-bound, light red) or 100% (100% ligand-bound, dark red). c Comparison of co-transcriptional folding at a transcription rate of 20 nt s−1 to equilibrium structures assuming the polymerase stalls at each nucleotide (<1 nt s−1). Equilibrium structures of transcriptional intermediates were determined previously (black trace). For a transcription rate of 20  nt s−1, simulations of co-transcriptional folding between transcript lengths 113 and 137 nt were fit into the corresponding graphs. The state adopted at nucleotide 137 is assumed to be maintained until the regulatory decision point. The ligand-free fraction between nucleotides 78 and 110 corresponds to a single-exponential decay resulting in either a 70% ligand-bound population at nucleotide 113 (~0.6 s−1) or a 100% ligand-bound population at nucleotide 90 (~2.3 s−1)
Fig. 6
Fig. 6
Fractions of ON state derived by in vitro transcriptions. a Secondary structure of dGsw illustrating determined pause sites including t1/2 values using Ecoli polymerase (Supplementary Fig. 6 and Table 4 b, c) fractions of ON state from E. coli RNAP mediated b single-round and c multi-round in vitro transcriptions performed in the absence (black) and presence of ligand (gray) at 37 °C, 25 °C, and 4 °C with an NTP concentration of 0.05 mM (b) and 0.1 mM (c) (Supplementary Fig. 5, 6). Indicated transcription rates are correlated to the time point, at which half of the polymerases have transcribed the corresponding mRNA fragment

References

    1. Mironov AS, et al. Sensing small molecules by nascent RNA: a mechanism to control transcription in bacteria. Cell. 2002;111:747–756. doi: 10.1016/S0092-8674(02)01134-0. - DOI - PubMed
    1. Winkler WC, Cohen-Chalamish S, Breaker RR. An mRNA structure that controls gene expression by binding FMN. Proc. Natl Acad. Sci. USA. 2002;99:15908–15913. doi: 10.1073/pnas.212628899. - DOI - PMC - PubMed
    1. Lemay JF, et al. Comparative study between transcriptionally- and translationally-acting adenine riboswitches reveals key differences in riboswitch regulatory mechanisms. PLoS Genet. 2011;7:e1001278. doi: 10.1371/journal.pgen.1001278. - DOI - PMC - PubMed
    1. Smith AM, Fuchs RT, Grundy FJ, Henkin TM. The SAM-responsive S(MK) box is a reversible riboswitch. Mol. Microbiol. 2010;78:1393–1402. doi: 10.1111/j.1365-2958.2010.07410.x. - DOI - PMC - PubMed
    1. Suddala KC, et al. Single transcriptional and translational preQ1 riboswitches adopt similar pre-folded ensembles that follow distinct folding pathways into the same ligand-bound structure. Nucleic Acids Res. 2013;41:10462–10475. doi: 10.1093/nar/gkt798. - DOI - PMC - PubMed

Publication types