. 2018 Mar 5;9(1):938.
doi: 10.1038/s41467-018-03118-x.

Uncovering the balance of forces driving microtubule aster migration in C. elegans zygotes

Affiliations

Uncovering the balance of forces driving microtubule aster migration in C. elegans zygotes

A De Simone et al. Nat Commun. .

Abstract

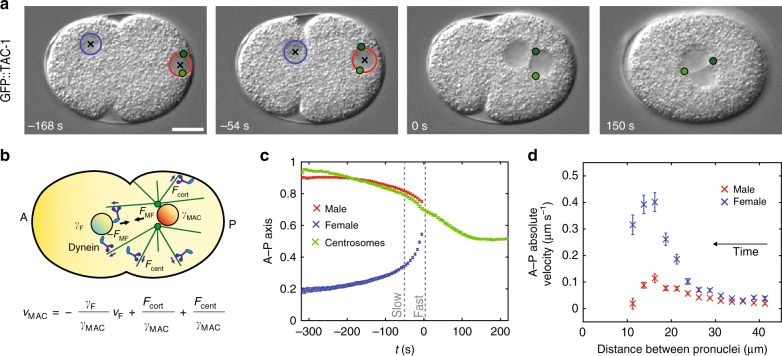
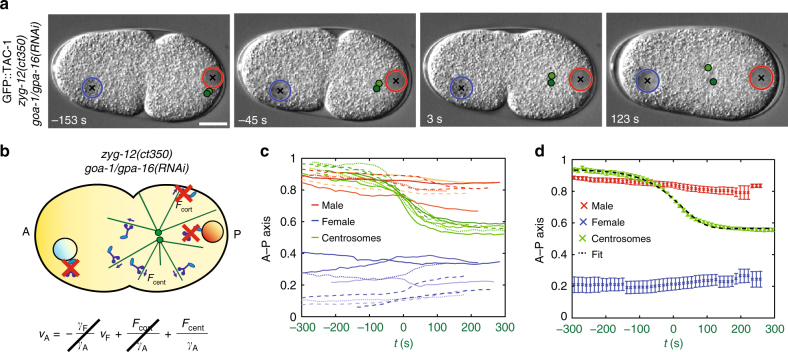
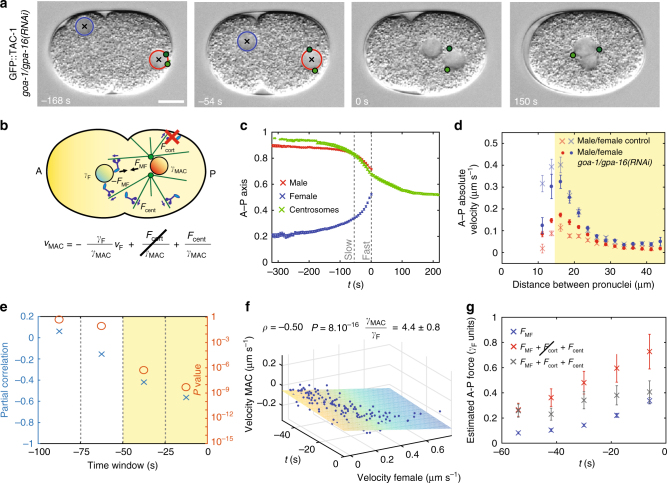
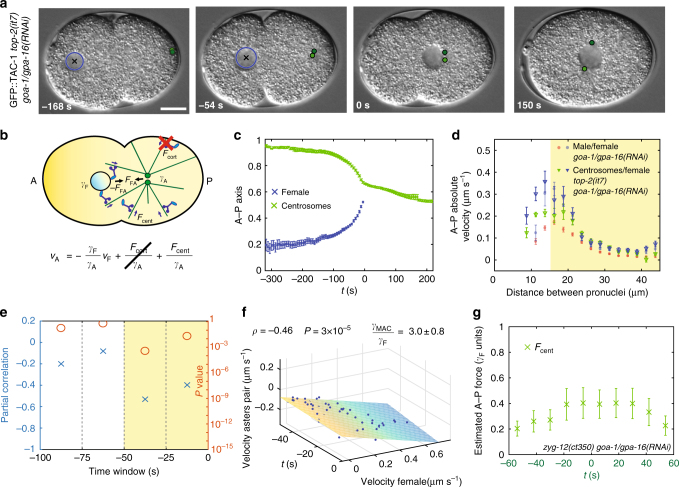
Microtubule asters must be positioned precisely within cells. How forces generated by molecular motors such as dynein are integrated in space and time to enable such positioning remains unclear. In particular, whereas aster movements depend on the drag caused by cytoplasm viscosity, in vivo drag measurements are lacking, precluding a thorough understanding of the mechanisms governing aster positioning. Here, we investigate this fundamental question during the migration of asters and pronuclei in C. elegans zygotes, a process essential for the mixing of parental genomes. Detailed quantification of these movements using the female pronucleus as an in vivo probe establish that the drag coefficient of the male-asters complex is approximately five times that of the female pronucleus. Further analysis of embryos lacking cortical dynein, the connection between asters and male pronucleus, or the male pronucleus altogether, uncovers the balance of dynein-driven forces that accurately position microtubule asters in C. elegans zygotes.


Conflict of interest statement

The authors declare no competing financial interests.

Figures

Fig. 1
Fig. 1
3D time-lapse microscopy of pronuclear migration and centration in the one-cell C. elegans embryo. a Pronuclei and centrosomes monitored with 3D time-lapse DIC and GFP fluorescence microscopy in embryos expressing GFP::TAC-1. Here and in other figures, representative DIC images are shown; centrosomes (green dots—z-projections), the female pronucleus (blue circle), and the male pronucleus (red circle) are represented; black crosses: pronuclei centers—z-projections. 0 s: pronuclear meeting unless specified otherwise; scale bars: 10 μm. b Schematics of forces acting on pronuclei during their migration. Here and in other figures, embryos are schematized with the female and male pronuclei (blue and red disks, respectively), centrosomes (green dots), microtubules (green lines), dynein motors (blue), and dynein anchors (light blue ellipses); arrows represent exerted forces. Anterior (A) and posterior (P) sides are indicated. c Average pronuclear and centrosome midpoint positions along the A–P axis as a function of time (n = 33, with S.E.M.). Here and thereafter, position on the A–P axis is represented in normalized coordinates (0: anterior; 1: posterior). d Absolute average pronuclear velocities as a function of the distance separating them, which decreases over time (n = 33, with S.E.M.). Velocities increase while pronuclei approach each other and then diminish when the male-asters complex and the female pronucleus get closer than ~15 μm from one another, probably because of steric hindrance effects. FMF force exerted between the male-asters complex and the female pronucleus, Fcort force exerted by cortical dynein, Fcent centering force, γFγMAC drag coefficient of the female pronucleus and male-asters complex, respectively
Fig. 2
Fig. 2
Centrosome movements upon depletion of cortical and nuclear dynein reveal centering force dynamics. a, b Snapshots and schematics of centrosome centration in zyg-12(ct350) goa-1/gpa-16(RNAi) embryos. Since pronuclear meeting does not occur in zyg-12(ct350) goa-1/gpa-16(RNAi) embryos, in this figure time 0 s is defined as the half-centration time (indicated by the green lettering on the x axis in c and d; Methods). In b of this and subsequent figures, the red crosses represent depleted dynein motors. c, d Pronuclei and centrosome midpoint positions along the A–P axis as a function of time in eight zyg-12(ct350) goa-1/gpa-16(RNAi) embryos (c), as well as their average, represented with S.E.M. d Black-dashed line in d: fit with sigmoidal model (Eq. 4—Methods, χ2 = 27, P = 0.99)
Fig. 3
Fig. 3
Pronuclear migration and centration upon depletion of cortical forces. a, b Snapshots and schematics of pronuclei and centrosomes in goa-1/gpa-16(RNAi) embryos. c Average pronuclear and centrosome midpoint positions along the A–P axis as a function of time, with S.E.M. (pronuclei: n = 31, centrosomes: n = 13). d Absolute average pronuclear velocities, with S.E.M., as a function of the distance separating them in the indicated conditions (control, n = 33, same as Fig. 1e; goa-1/gpa-16(RNAi), n = 31; here and in e, f, velocities are calculated between successive frames 6 s apart). The velocities during the acceleration phase of the female pronucleus in control and goa-1/gpa-16(RNAi) embryos are compatible (d > 15 µm, highlighted in yellow; χ2 = 12; P = 0.37), whereas those of the male-asters complex are not (χ2 = 70; P < 2 × 10−10). e Partial Pearson's correlation, controlling for time variation, between pronuclear velocities along the A–P axis over successive time windows (n = 31). Here and in other figures, each time point corresponds to a time window of 25 s and the correlated time window (P < 0.05) is highlighted in yellow (partial correlation: blue crosses; P value (Student's t test, two-sided): orange circles). f Velocity of male pronucleus as a function of time and velocity of the female pronucleus during the correlated phase of pronuclear migration in goa-1/gpa-16(RNAi) embryos (n = 31, −50 < t < 0 s time window). Plane: linear fit vMAC=-γFγMACvF+v0+mtv0=-0.10±0.01μms-1;m=-0.0008±0.0003μms-2;errorsareS.D.. Here and in Fig. 4f, the Pearson’s partial correlation coefficient ρ between the velocities of the male-aster complex (or asters pair) and female pronucleus, controlling for time variation, its P value (Student’s t test, two-sided) and the fitted ratio between the drag coefficients of the male-asters complex (or asters pair) and female pronucleus are indicated. g Estimated A–P forces (with S.E.M.) acting on the male-asters complex and female pronucleus shortly before their meeting. Blue: force between pronuclei (n = 31). Red: sum of forces acting between pronuclei and centering force (n = 31). Gray: total force acting on male-asters complex in control embryos (n = 33). Here and in Fig. 4g, force is expressed in units of the drag of the female pronucleus, estimated to be ~130 pN s μm−1 (Methods)
Fig. 4
Fig. 4
Centrosome movements upon depletion of cortical dynein and without male pronucleus uncover drag coefficient of microtubule asters. a, b Snapshots and schematics of movements of female pronucleus and centrosomes in top-2(it7) goa-1/gpa-16(RNAi) embryo. In this figure, time 0 s is at meeting of the asters with the female pronucleus. c Average female pronucleus and centrosome midpoint positions along the A–P axis as a function of time, with S.E.M. (n = 10). d Absolute average velocities, with S.E.M., of the female pronucleus and the centrosome pair as a function of their distance in the indicated conditions (goa-1/gpa-16(RNAi), n = 31, same as in Fig. 3d; top-2(it7) goa-1/gpa-16(RNAi), n = 10; here and in e, f, velocities are calculated between successive frames 6 s apart. The velocities of the female pronucleus during the acceleration phase in goa-1/gpa-16(RNAi) and top-2(it7) goa-1/gpa-16(RNAi) are compatible (d > 15 µm, highlighted in yellow; χ2 = 9; P = 0.76), whereas the velocities of the male-asters complex and of the asters pair are not (χ2 = 105; P < 1 × 10−16). e Partial Pearson’s correlation, controlling for time variation, between the velocities of the female pronucleus and the two asters along the A–P axis over successive time windows (n = 10, partial correlation: blue crosses; P value (Student's t test, two-sided): orange circles; the correlated time window is highlighted in yellow). f Velocity of male pronucleus as a function of time and of female pronucleus velocity during the correlated phase of pronuclear migration in top-2(it7) goa-1/gpa-16(RNAi) embryos (n = 10, −50 < t < 0 s time window). Plane: linear fit vA=-γFγMACvF+v0+mtv0=-0.11±0.04μms-1;m=-0.0005±0.0008μms-2;errorsareS.D.. g Centering force (with S.E.M., n =8 ) acting on the asters pair in zyg-12(ct350) goa-1/gpa-16(RNAi) embryos as a function of time. Since pronuclear meeting does not occur in zyg-12(ct350) goa-1/gpa-16(RNAi) embryos, time 0 s is defined as the half-centration time (indicated by the green lettering on the x axis; Methods)

Similar articles

Cited by

References

    1. Reinsch S, Gönczy P. Mechanisms of nuclear positioning. J. Cell Sci. 1998;111:2283–2295. - PubMed
    1. McNally FJ. Mechanisms of spindle positioning. J. Cell Biol. 2013;200:131–40. doi: 10.1083/jcb.201210007. - DOI - PMC - PubMed
    1. Gundersen GG, Worman HJ. Nuclear positioning. Cell. 2013;152:1376–1389. doi: 10.1016/j.cell.2013.02.031. - DOI - PMC - PubMed
    1. Tran PT, Marsh L, Doye V, Inoué S, Chang F. A mechanism for nuclear positioning in fission yeast based on microtubule pushing. J. Cell Biol. 2001;153:397–411. doi: 10.1083/jcb.153.2.397. - DOI - PMC - PubMed
    1. Zhu J, Burakov A, Rodionov V, Mogilner A. Finding the cell center by a balance of dynein and myosin pulling and microtubule pushing: a computational study. Mol. Biol. Cell. 2010;21:4418–27. doi: 10.1091/mbc.E10-07-0627. - DOI - PMC - PubMed

Publication types

LinkOut - more resources