Comparative Study
. 2018 Mar 5;8(1):4011.
doi: 10.1038/s41598-018-22295-9.

Voxel-wise comparisons of cellular microstructure and diffusion-MRI in mouse hippocampus using 3D Bridging of Optically-clear histology with Neuroimaging Data (3D-BOND)

Affiliations
Comparative Study

Voxel-wise comparisons of cellular microstructure and diffusion-MRI in mouse hippocampus using 3D Bridging of Optically-clear histology with Neuroimaging Data (3D-BOND)

H B Stolp et al. Sci Rep. .

Abstract

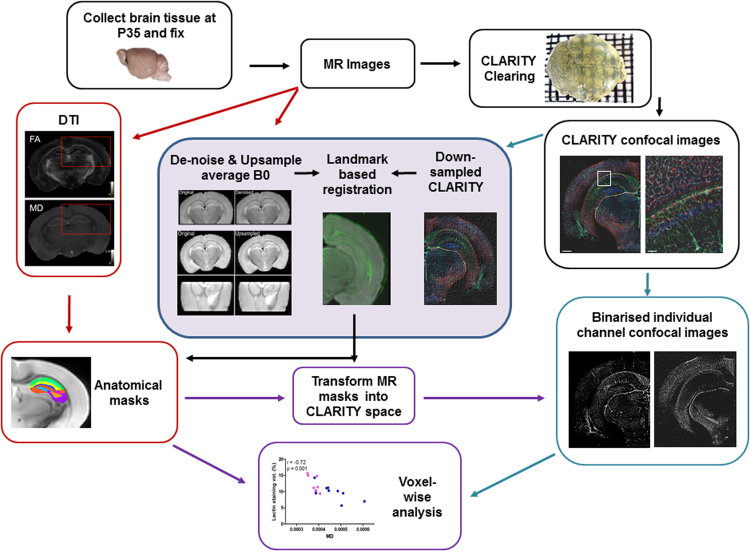
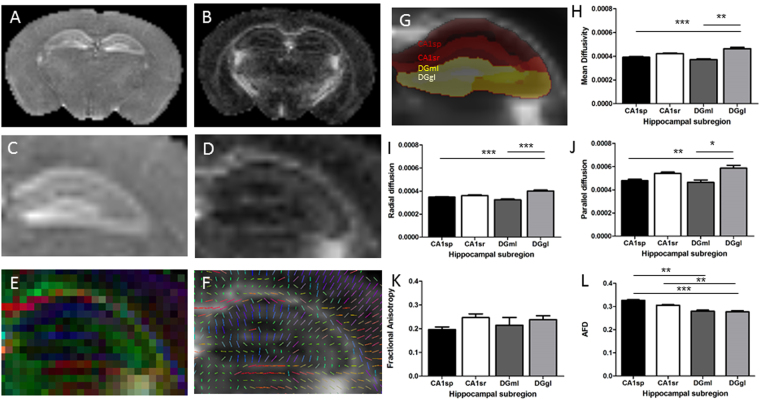
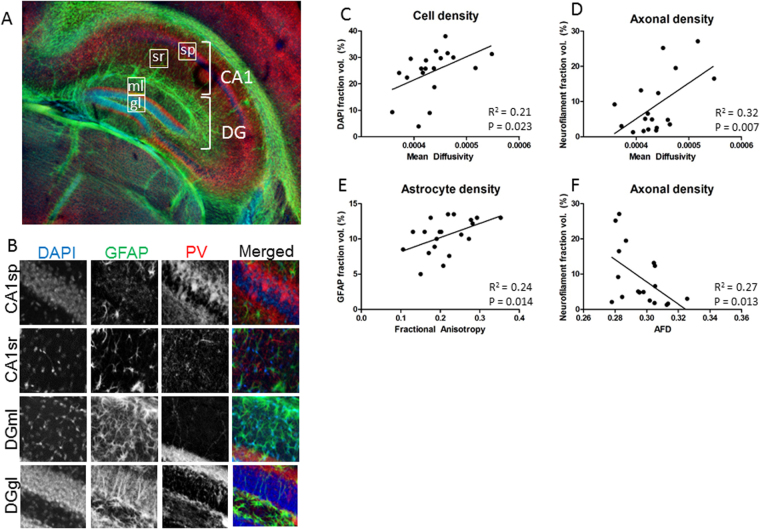
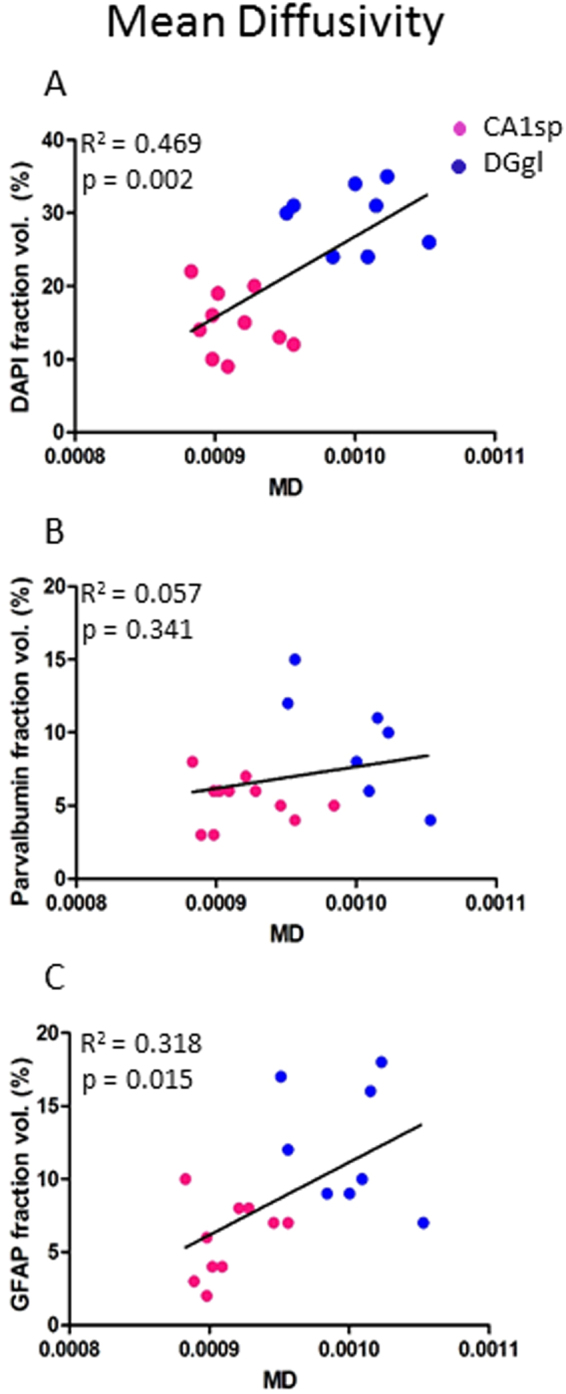
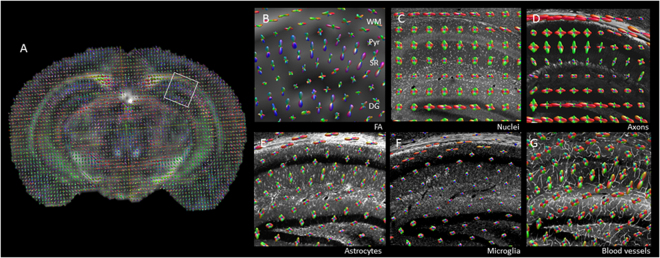
A key challenge in medical imaging is determining a precise correspondence between image properties and tissue microstructure. This comparison is hindered by disparate scales and resolutions between medical imaging and histology. We present a new technique, 3D Bridging of Optically-clear histology with Neuroimaging Data (3D-BOND), for registering medical images with 3D histology to overcome these limitations. Ex vivo 120 × 120 × 200 μm resolution diffusion-MRI (dMRI) data was acquired at 7 T from adult C57Bl/6 mouse hippocampus. Tissue was then optically cleared using CLARITY and stained with cellular markers and confocal microscopy used to produce high-resolution images of the 3D-tissue microstructure. For each sample, a dense array of hippocampal landmarks was used to drive registration between upsampled dMRI data and the corresponding confocal images. The cell population in each MRI voxel was determined within hippocampal subregions and compared to MRI-derived metrics. 3D-BOND provided robust voxel-wise, cellular correlates of dMRI data. CA1 pyramidal and dentate gyrus granular layers had significantly different mean diffusivity (p > 0.001), which was related to microstructural features. Overall, mean and radial diffusivity correlated with cell and axon density and fractional anisotropy with astrocyte density, while apparent fibre density correlated negatively with axon density. Astrocytes, axons and blood vessels correlated to tensor orientation.


Conflict of interest statement

The authors declare no competing interests.

Figures

Figure 1
Figure 1
3D-BOND Workflow. Ex vivo, high-resolution dMRI was performed on fixed mouse brains which were then optically-cleared with CLARITY-based processing. Tissue was fluorescently stained with CLARITY-validated, cell-specific antibodies and imaged using confocal microscopy. MR and confocal images were processed and registered before voxel-wise analyses.
Figure 2
Figure 2
3D histological data from optically-clear tissue at macro- and microscale. CLARITY-processing combined with immunohistochemistry and confocal microscopy allowed whole brain imaging at cellular resolution. (A) GFAP-positive astrocytes (green), parvalbumin-positive interneurons (red) and tomato lectin-positive blood vessels (white) with DAPI stained cell nuclei (blue) in a cerebral hemisphere from an adult mouse brain. (B) High magnification image of boxed region from (A) shows the resolution of the image. (C and D) Individual channels were separated to show regional differences in cellular distribution, (C) green channel - GFAP positive astrocytes are particularly dense within the hippocampus and white matter, (D) red channel - parvalbumin positive interneurons are predominantly found within the cortex and pyramidal layers of the hippocampaus. Scale bar: A,C and D = 1 mm, B = 100 μm.
Figure 3
Figure 3
MRI imaging & processing. Mean diffusivity (MD; A,C) and fractional anisotropy (FA; B,D) maps were calculated from 42-direction dMRI. Data was also visualised as RGB and line vector maps of diffusion directions (E,F). Diffusion metrics were calculated for two of the CA1 hippocampal layers (CA1sp and CA1sr) and two of the DG hippocampal layers (DGgl and DGml), illustrated in G. Variations in mean diffusivity (H), radial diffusion (I) parallel diffusion (J), fractional anisotropy (K), and apparent fibre density (L) were assessed, showing significant differences between the DGgl and other layers. *p < 0.05, **p < 0.01, ***p < 0.001.
Figure 4
Figure 4
Differences in diffusion in hippocampal subregions. (A,B) Cellular imaging of the hippocampus shows regional variation in microstructure. Example voxels from each hippocampal region are outlined in (A), and showed at higher magnification in (B). DAPI (cell nuclei), PV (interneuron population) and GFAP (astrocytes) are differentially distributed within the CA1sp, CA1sr, DGgl and DGml cell layers. (C) Mean diffusivity correlates with DAPI staining area, reflective of cell density. (D) Mean diffusivity also correlates with axonal density. (E) Fractional anisotropy only correlates with astrocytes staining density, as shown with GFAP. (F) Axonal density, quantified from neurofilament staining area, negatively correlated with apparent fibre density in the hippocampal subregions examined.
Figure 5
Figure 5
Secondary influences of microstructure on diffusion metrics in hippocampal subregions. When the two cell dense regions were examined for the way their cellular microstructure correlated with mean diffusivity, there was clear separation of data from the CA1sp region (pink dots) and the DGgl region (blue dots). This resulted in a statistically significant correlation between mean diffusivity and cell density (A) and astrocyte density (C), but not parvalbumin interneuron density (B).
Figure 6
Figure 6
Directionality of microstructure aligns with dMRI. (A) Orientation density functions (ODFs) were calculated from dMRI data, and were overlaid on the fractional anisotropy image of the brain. dMRI data was aligned with 3D-histology from CLARITY processed tissue. ODFs were compared in the hippocampus between MRI (B), cell density (C), axon staining (D), astrocytes (E), microglia (F) and blood vessels (G). Similar alignment of ODFs was seen in the white matter (WM) when dMRI was compared with astrocyte and axon staining, while alignment in the stratum radiatum (SR) was similar comparing dMRI, astrocytes and blood vessels.

References

    1. Nir TM, et al. Effectiveness of regional DTI measures in distinguishing Alzheimer’s disease, MCI, and normal aging. NeuroImage. Clinical. 2013;3:180–195. doi: 10.1016/j.nicl.2013.07.006. - DOI - PMC - PubMed
    1. Trojsi F, et al. Microstructural changes across different clinical milestones of disease in amyotrophic lateral sclerosis. PloS one. 2015;10:e0119045. doi: 10.1371/journal.pone.0119045. - DOI - PMC - PubMed
    1. Labate A, et al. White matter abnormalities differentiate severe from benign temporal lobe epilepsy. Epilepsia. 2015;56:1109–1116. doi: 10.1111/epi.13027. - DOI - PubMed
    1. Zhang B, Xu Y, Zhu B, Kantarci K. The role of diffusion tensor imaging in detecting microstructural changes in prodromal Alzheimer’s disease. CNS neuroscience & therapeutics. 2014;20:3–9. doi: 10.1111/cns.12166. - DOI - PMC - PubMed
    1. Wells JA, et al. In vivo imaging of tau pathology using multi-parametric quantitative MRI. NeuroImage. 2015;111:369–378. doi: 10.1016/j.neuroimage.2015.02.023. - DOI - PMC - PubMed

Publication types