. 2018 Mar 5;8(1):4025.
doi: 10.1038/s41598-018-22391-w.

Allogeneic dendritic cells stimulated with antibodies against HLA class II polarize naive T cells in a follicular helper phenotype

Affiliations

Allogeneic dendritic cells stimulated with antibodies against HLA class II polarize naive T cells in a follicular helper phenotype

Olivier Désy et al. Sci Rep. .

Abstract

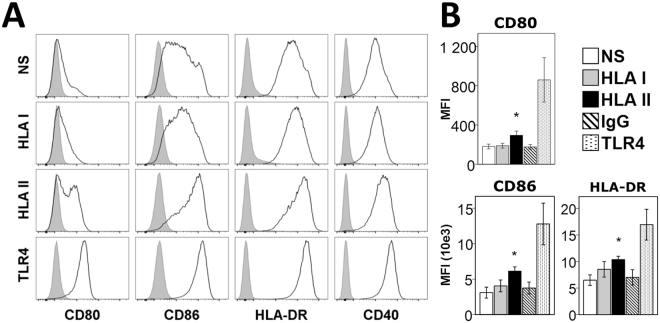
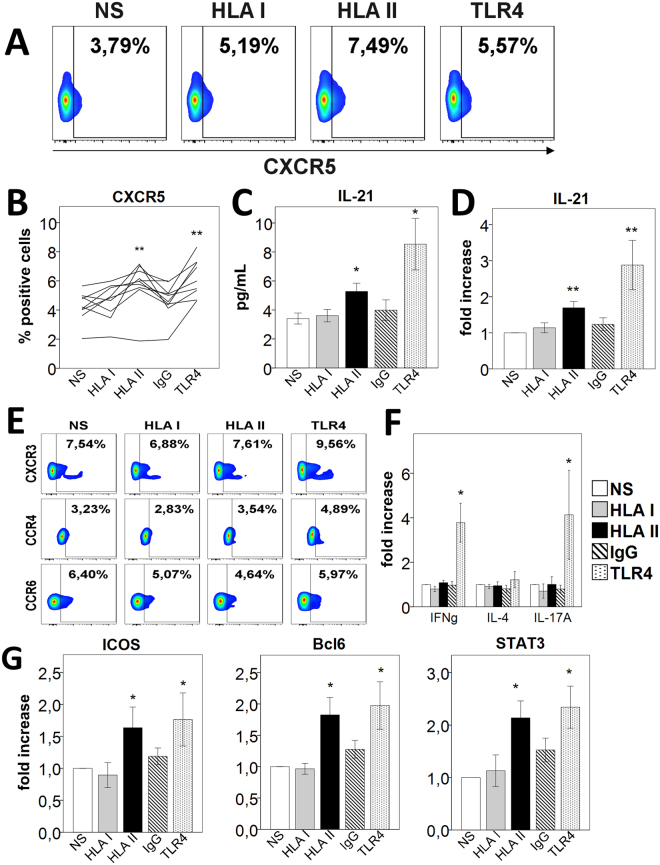
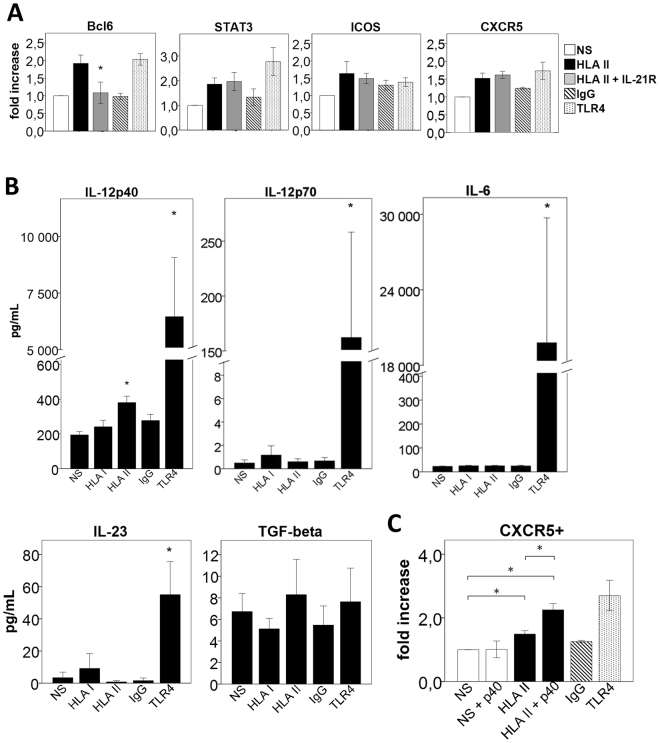
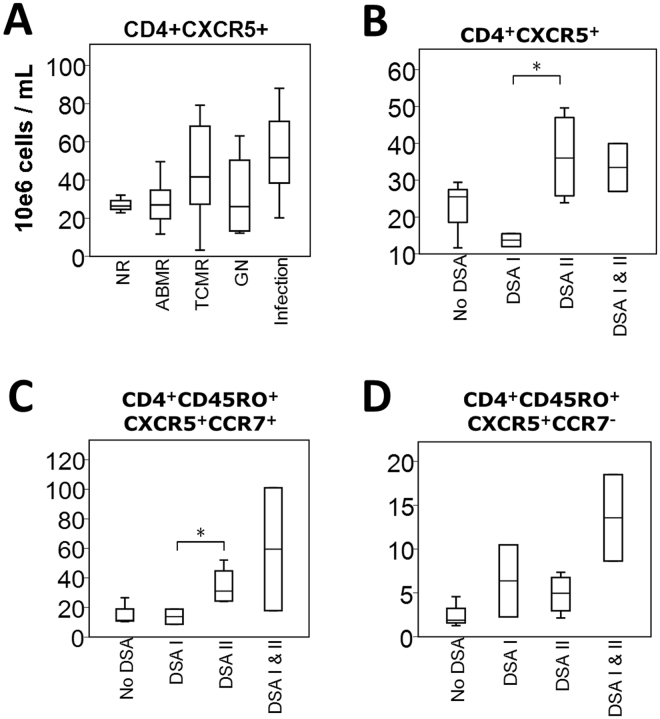
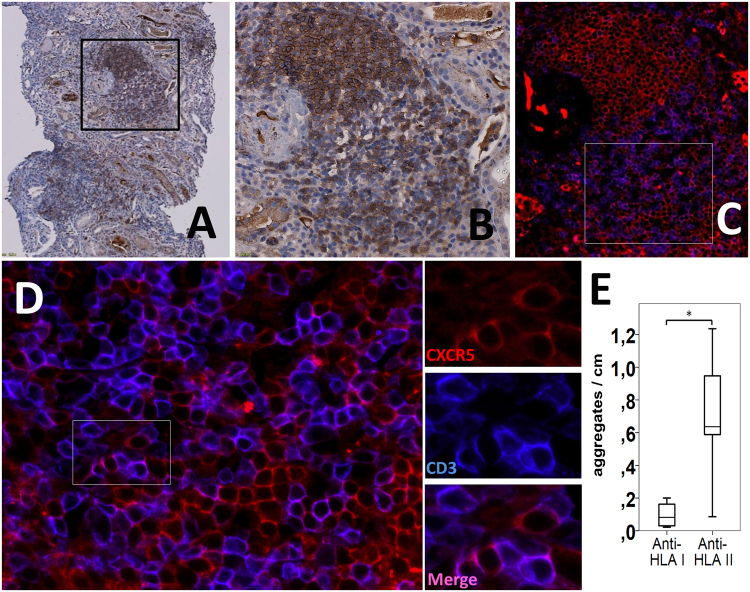
Follicular helper T cells (Tfh) are crucial for the production of high-affinity antibodies, such as alloantibodies, by providing the signals for B-cell proliferation and differentiation. Here, we demonstrate that human allogeneic dendritic cells (DC) stimulated with antibodies against HLA class II antigens preferentially differentiate human naive CD4+ T cells into Tfh cells. Following coculture with DCs treated with these antibodies, CD4+ T cells expressed CXCR5, ICOS, IL-21, Bcl-6 and phosphorylated STAT3. Blockade of IL-21 abrogated Bcl-6, while addition of the IL-12p40 subunit to the coculture increased CXCR5, Bcl-6, phosphorylated STAT3 and ICOS, indicating that they were both involved in Tfh polarization. We further phenotyped the peripheral T cells in a cohort of 55 kidney transplant recipients. Patients with anti-HLA-II donor-specific antibodies (DSA) presented higher blood counts of circulating Tfh cells than those with anti-HLA-I DSAs. Moreover, there was a predominance of lymphoid aggregates containing Tfh cells in biopsies from patients with antibody-mediated rejection and anti-HLA-II DSAs. Collectively, these data suggest that alloantibodies against HLA class II specifically promote the differentiation of naive T cells to Tfh cells following contact with DCs, a process that might appear in situ in human allografts and constitutes a therapeutic target.


Conflict of interest statement

The authors declare no competing interests.

Figures

Figure 1
Figure 1
Phenotypes of moDCs after stimulation with HLA I and HLA II antibodies. (A) Flow cytometry analysis of the surface phenotype of moDCs following stimulation for 48 h. Closed gray histograms indicate isotype control and black line histograms indicate markers of interest. One representative experiment out of 11 performed is shown. (B) Summarized data of Median Fluorescence Intensity (MFI) for CD80, CD86 and HLA-DR in differentiated moDCs. The means ± SEM of 11 experiments are shown. *p < 0.05.
Figure 2
Figure 2
HLA-II-moDCs polarize CD4+ naive T cells into a Tfh phenotype. In all experiments, CD4+ naive T cells were cocultured with stimulated moDCs for 6 days. (A) Flow cytometry analysis of CXCR5 surface expression (gated on CD4+cells). One representative experiment out of 9 performed is shown. (B) Summary analysis of the CXCR5 percentage expression. Each line represents a single experiment (n = 9). (C) Cell culture supernatants were analyzed for IL-21 production by ELISA (mean ± SEM, n = 9). (D) Summarized data for intracellular IL-21 levels by flow cytometry. Values are expressed as the fold increase in IL-21 levels compared with levels in untreated cells (mean ± SEM, n = 13). (E) Flow cytometry analysis for Th1 (CXCR3), Th2 (CCR4) and Th17 (CCR6) surface marker expression (gated on CD4+ cells). One representative experiment of 9 was shown. (F) Coculture supernatants were analyzed for IFN-γ, IL-4 and IL-17A levels by ELISA. Values are expressed as fold increase in cytokine levels compared with levels in unstimulated cells (mean ± SEM, n = 9). (G) Flow cytometry analysis for the surface expression of ICOS and the intracellular expression of Bcl-6 and pSTAT3 in CD4+45RA+ T cells stimulated with moDCs for 6 days (mean ± SEM, n ≥ 4). *p < 0.05; NS, non-stimulated; IgG, isotype control.
Figure 3
Figure 3
Regulation of the expression of Tfh-specific transcription factors and surface phenotype. (A) Flow cytometry analysis of intracellular Bcl-6, pSTAT3 and surface expression of ICOS and CXCR5 in CD4+ T cells stimulated with allogeneic unstimulated moDCs (NS), HLA-II-moDCs (HLA II), HLA II + IL21R-moDCs (HLA II + IL21 inh), IgG2a-moDCs (IgG) and TLR4 for 6 days. Values are expressed as fold increase in marker levels compared to levels in unstimulated cells (mean ± SEM, n = 4). The mean ± SEM of 4 experiments are shown. (B) Cytokine levels measured in supernatants of DC cultures (mean ± SEM, n = 10). (C) Flow cytometry analysis of CXCR5 in CD4+ T cells stimulated with NS, NS + p40 subunit of IL-12, HLA II, HLA II + p40 subunit of IL-12, IgG and TLR4 for 6 days (mean ± SEM, n = 5). *p < 0.05; NS, non-stimulated; IgG, isotype control.
Figure 4
Figure 4
Relationship between absolute blood cell counts and the clinical status of kidney transplant recipients. (A) Boxplots (25th, median, 75th percentile) of CD4+CXCR5+ absolute blood counts are shown for non-rejectors (NR), antibody-mediated rejectors (ABMR), T-cell mediated rejectors (TCMR), patients with recurrent autoimmune glomerulonephritis (GN) and patients with infection (n = 55 total). (BD) Comparison of absolute CD4+CXCR5+, CD4+CD45RO+CXCR5+CCR7+ and CD4+CD45RO+CXCR5+CCR7- blood counts in patients with ABMR. We compared blood cell counts among patients with no circulating DSAs, patients with DSAs against HLA class I, patients with DSAs against HLA class II and patients with DSAs against both HLA classes (n = 12 total). *p < 0.05; DSAs, donor-specific antibody.
Figure 5
Figure 5
Tfh cells infiltrate the allograft of patients with circulating anti-HLA class II DSAs. (A,B) Representative photomicrographs (×10 and 20) of CXCR5+ cells (brown) in a patient with ABMR and circulating anti-HLA class II DSAs by immunohistochemical staining. (C,D) Dual immunofluorescence (× 20 to 80) staining of the same area as shown in B and high-power magnifications confirms the presence of Tfh cells by colocalization of CXCR5 (red) and CD3 (blue) in lymphoid aggregates. Some areas of the infiltrate were enriched with CD3CXCR5+ B cells, whereas CD3+CXCR5+ T cells were scattered in other zones. (E) Summarized data (boxplots of 25th percentile, median and 75th percentile) for the number of aggregates containing CD3+CXCR5+ T cells per cm of tissue in patients with ABMR and antibodies against HLA class I (anti-HLA I) compared to antibodies against HLA class II (anti-HLA II) DSAs (n = 9). *p < 0.05.

Similar articles

Cited by

References

    1. Nankivell BJ, et al. The natural history of chronic allograft nephropathy. The New England journal of medicine. 2003;349:2326–2333. doi: 10.1056/NEJMoa020009. - DOI - PubMed
    1. El-Zoghby ZM, et al. Identifying specific causes of kidney allograft loss. American journal of transplantation: official journal of the American Society of Transplantation and the American Society of Transplant Surgeons. 2009;9:527–535. doi: 10.1111/j.1600-6143.2008.02519.x. - DOI - PubMed
    1. Sellares J, et al. Understanding the causes of kidney transplant failure: the dominant role of antibody-mediated rejection and nonadherence. American journal of transplantation: official journal of the American Society of Transplantation and the American Society of Transplant Surgeons. 2012;12:388–399. doi: 10.1111/j.1600-6143.2011.03840.x. - DOI - PubMed
    1. Sellares J, et al. Molecular diagnosis of antibody-mediated rejection in human kidney transplants. American journal of transplantation: official journal of the American Society of Transplantation and the American Society of Transplant Surgeons. 2013;13:971–983. doi: 10.1111/ajt.12150. - DOI - PubMed
    1. Muller-Steinhardt M, Fricke L, Kirchner H, Hoyer J, Kluter H. Monitoring of anti-HLA class I and II antibodies by flow cytometry in patients after first cadaveric kidney transplantation. Clin Transplant. 2000;14:85–89. doi: 10.1034/j.1399-0012.2000.140116.x. - DOI - PubMed

Publication types