. 2018 Apr;21(4):638-646.
doi: 10.1038/s41593-018-0091-7. Epub 2018 Mar 5.

Nontoxic, double-deletion-mutant rabies viral vectors for retrograde targeting of projection neurons

Affiliations

Nontoxic, double-deletion-mutant rabies viral vectors for retrograde targeting of projection neurons

Soumya Chatterjee et al. Nat Neurosci. 2018 Apr.

Abstract

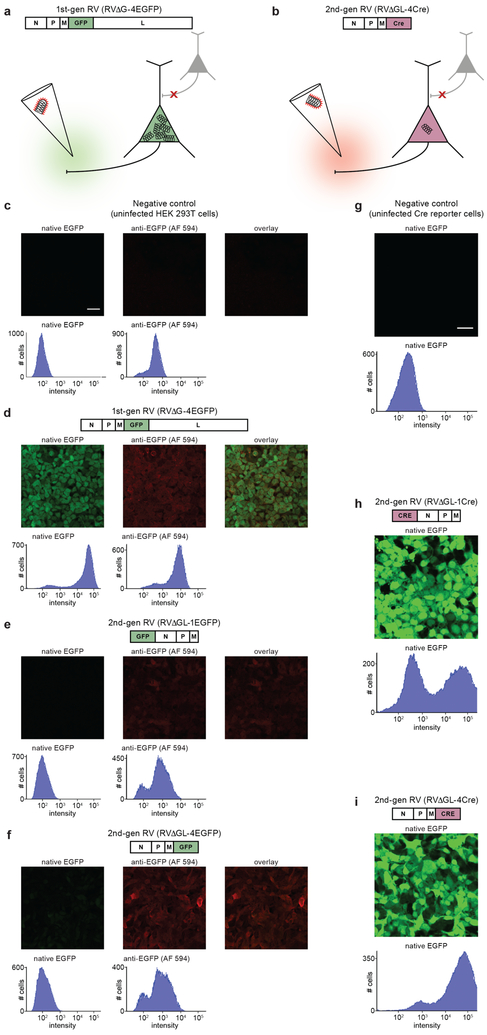
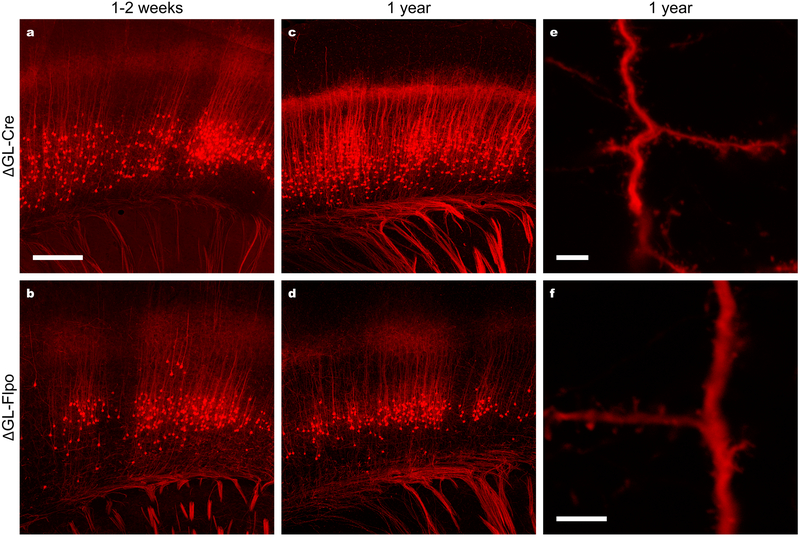
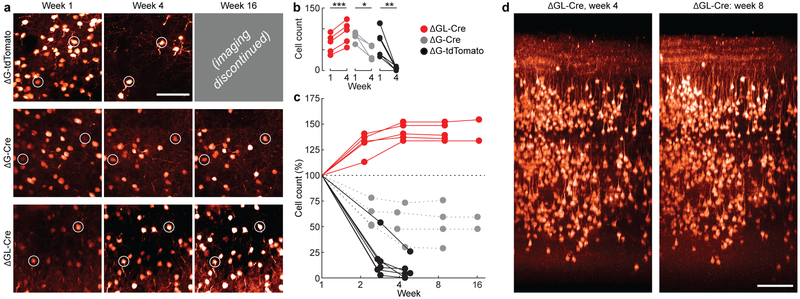
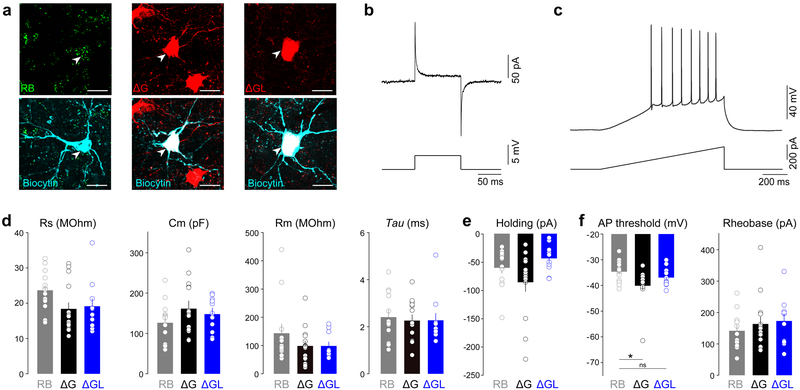
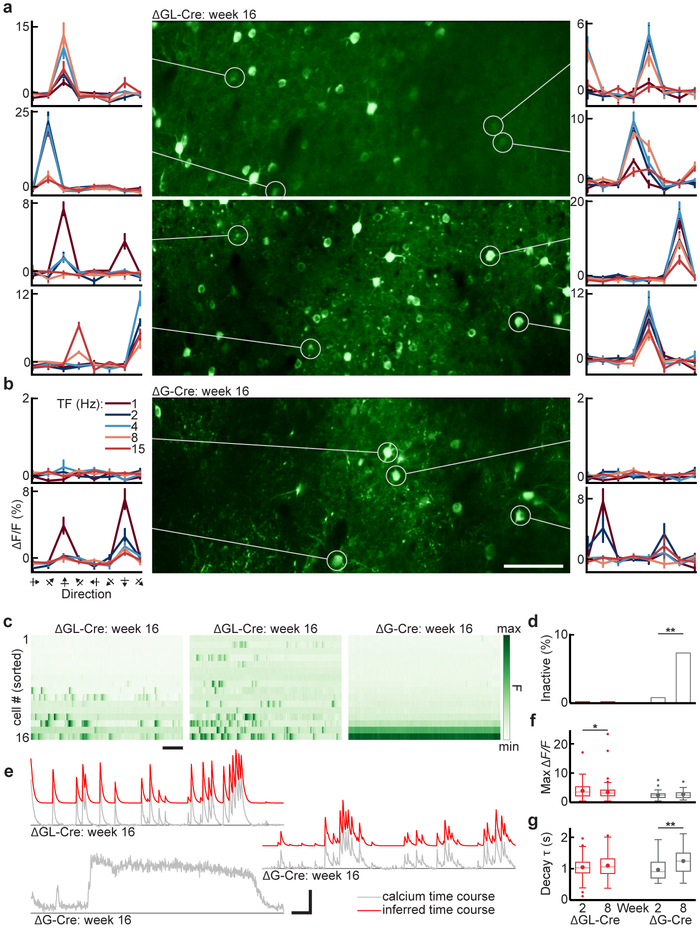
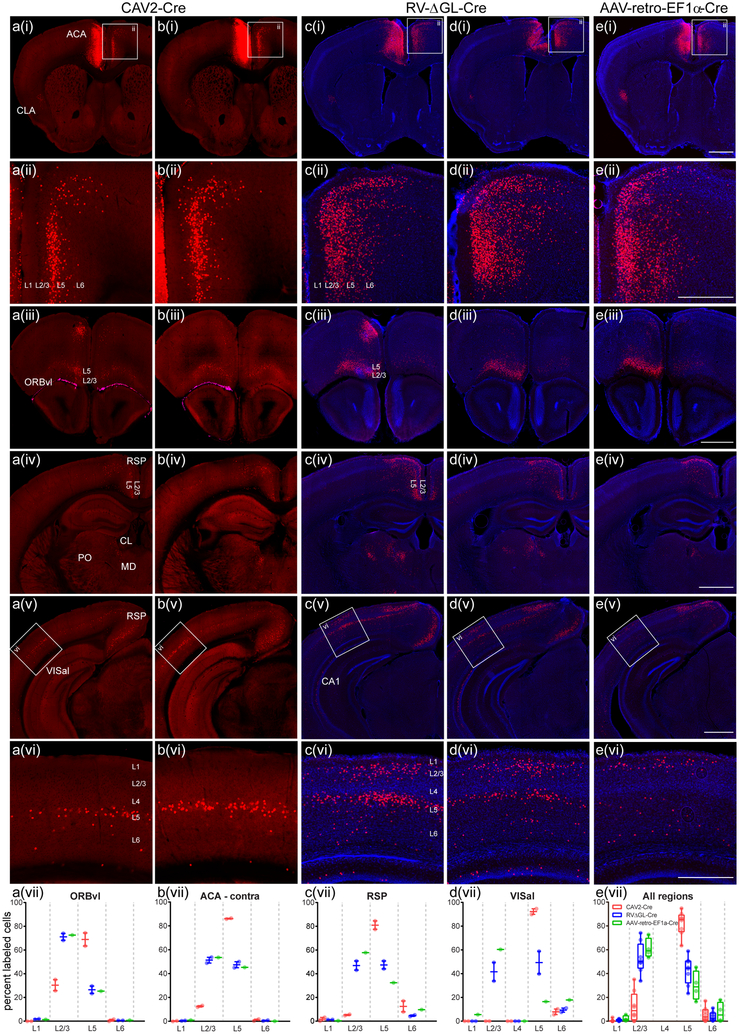
Recombinant rabies viral vectors have proven useful for applications including retrograde targeting of projection neurons and monosynaptic tracing, but their cytotoxicity has limited their use to short-term experiments. Here we introduce a new class of double-deletion-mutant rabies viral vectors that left transduced cells alive and healthy indefinitely. Deletion of the viral polymerase gene abolished cytotoxicity and reduced transgene expression to trace levels but left vectors still able to retrogradely infect projection neurons and express recombinases, allowing downstream expression of other transgene products such as fluorophores and calcium indicators. The morphology of retrogradely targeted cells appeared unperturbed at 1 year postinjection. Whole-cell patch-clamp recordings showed no physiological abnormalities at 8 weeks. Longitudinal two-photon structural and functional imaging in vivo, tracking thousands of individual neurons for up to 4 months, showed that transduced neurons did not die but retained stable visual response properties even at the longest time points imaged.


Conflict of interest statement

Competing financial interests statement

The authors have no competing financial interests.

Figures

Figure 1.
Figure 1.. Deletion of the rabies viral polymerase gene reduces gene expression to trace levels but leaves recombinase-encoding vectors still able to cause reporter expression in cell culture.
(ab) Strategy for eliminating the toxicity of rabies viral vectors. (a) In first-generation vectors, only the G gene, encoding the envelope glycoprotein, is deleted. This prevents the virus from spreading beyond directly infected cells but still allows the virus to replicate within them, resulting in rapid, high transgene expression as well as severe toxicity on the timescale of 1–2 weeks. (b) In the second-generation RV vectors introduced here, the L gene, encoding the viral polymerase, has also been deleted to reduce expression from the viral genome to trace levels. Because transgene expression should therefore also be reduced, the gene for a recombinase, such as Cre or Flp, is used in order to allow the expected very low expression levels to cause subsequent expression of a reporter at experimentally useful levels. (ci) Results in cell culture: images and flow cytometric histograms show EGFP fluorescence levels in cells infected by first- and second-generation RV vectors. Left-hand images and histograms in (cf) show native EGFP fluorescence; middle images and right-hand histograms in (cf) show anti-GFP immunolabeling with AlexaFluor 594 secondary antibody; right-hand images show overlay of left-hand and middle images. X-axes of histograms are log scale with arbitrary units. (c) Negative control: HEK 293T cells not infected with any virus do not express EGFP, as indicated by the single peak at a very low fluorescence level. (d) A first-generation RV vector encoding EGFP causes infected HEK cells to fluoresce brightly, as shown by the peak far to the right of the histogram (the leftmost peak represents uninfected cells in the same well). (ef) Second-generation RV vectors encoding EGFP cause almost undetectable EGFP expression in infected cells, as shown by histograms that resemble that of the uninfected cells shown in (c); immunostaining for EGFP shows that virus is nonetheless present and producing EGFP at low levels. This is true whether the EGFP gene is placed in the most highly-expressing locus at the start of the viral genome (e) or in the “usual” transgene locus of the deleted G gene (f). (gi) We then constructed second-generation RV vectors encoding Cre recombinase and tested them in reporter cells that express EGFP when Cre is expressed. (g) Negative control: uninfected reporter cells express very little EGFP. (hi) Reporter cells infected with second-generation RV vectors encoding Cre express lots of EGFP. This is true whether the Cre gene is inserted at the start of the RV genome (h) or into the G locus (i). Experiments in this figure were performed twice with similar results each time. Scale bar in (c): 33 μm, applies to (cf); scale bar in (g): 33 μm, applies to (gi).
Figure 2.
Figure 2.. Second-generation rabies viral vectors encoding Cre and Flp retrogradely infect projection neurons, activate reporter expression, and cause no apparent morphological abnormalities even up to a year after injection.
(ab) Cortical neurons retrogradely labeled by second-generation RV vectors encoding either Cre (a; 7d survival) or Flp (b; 14 d survival) recombinase injected into somatosensory thalamus of tdTomato reporter mice. (cd) Cortical neurons retrogradely labeled by second-generation RV vectors encoding Cre (c) or Flp recombinase (d) injected into the thalamus of a Flp reporter mouse one year before perfusion. (ef) High-magnification images of dendrites and other fine processes of cortical neurons from the same sections imaged for (c) and (e), showing apparently normal morphology with a complete absence of decomposition, blebbing, or other abnormalities. These results indicate, first, that second-generation RV vectors are capable of expressing recombinases at levels sufficient to activate downstream transgene expression in readily available reporter mice; second, that second-generation RV vectors are capable of efficient retrograde infection of projection neurons; third, that the new vectors can be used to express different recombinases, allowing a variety of potential intersectional applications; fourth, that the new vectors do not appear to cause cytotoxicity even on time scales comparable to the lifetime of the animal. Experiments in this figure were performed in 2–3 animals each condition with similar results in all cases per condition. Scale bar in (a): 250 μm, applies to (ab); scale bars in (e,f): 5 μm.
Figure 3.
Figure 3.. Longitudinal two-photon structural imaging shows that cortical neurons transduced with second-generation rabies viral vectors remain alive and structurally normal for at least 4 months.
(a) Example two-photon fields of view (FOVs) transduced with first-generation RV encoding tdTomato (top row), first-generation RV encoding Cre in a tdTomato reporter mouse (middle row), and second-generation RV encoding Cre in a tdTomato reporter mouse (bottom row), at 1 week (left column), 4 weeks (middle column), and 16 weeks (right column) after injection. Images within each column are of the same FOV imaged at the different time points. Two cells surviving across all time points for each animal have been circled as fiducial markers. As seen in the top row, first-generation RV encoding tdTomato kills almost all infected cells within 4 weeks of infection, in agreement with earlier work with similar vectors. Imaging was therefore not continued past 4 weeks for these mice. As seen in the middle row, first-generation RV encoding Cre (as opposed to a fluorophore) unexpectedly kills only about half of infected neurons over the first few weeks. As seen in the bottom row, none of the neurons visibly labeled by the second-generation RV disappear over time. (b) Population data for all structural FOVs in the study, comparing absolute cell counts between weeks 1 and 4. There is a significant increase in labeled ΔGL-Cre neurons (red, 5 FOVs; two-sided paired t(4) = 11.3, ***p = 3.5×10⁻⁴) and significant die-off in both ΔG-Cre (gray, 4 FOVs; paired t(3) = 4.47, *p = 0.021) and ΔG-tdTomato conditions (black, 6 FOVs; paired t(5) = 4.73, **p = 5.2×10⁻³). (c) Percentage visible labeled cells over time, relative to the number visible at 1 week postinjection, for each of the three viruses; connected sets of dots represent counts obtained from the same FOV within the same brain at the different time points. Cells labeled by first-generation RV encoding tdTomato (black) have almost entirely disappeared by four weeks postinjection. Cells labeled by first-generation RV encoding Cre (gray) have in many cases disappeared by four weeks, but approximately half remain and survive even to eight weeks. Cells labeled by second-generation RV encoding Cre (red) do not die at any point: the numbers of visibly labeled cells increase up to four weeks postinfection (presumably as previously subthreshold tdTomato levels accumulate to the level of detectability) and then remain constant for as long as imaging is continued and presumably for the lifetime of the animal. (d) Example renderings of the same volume of cortex labeled by second-generation RV encoding Cre at two different imaging time points, four weeks and eight weeks. Every single neuron visible at four weeks is still present at eight weeks. This was consistent across the 5 ΔGL-Cre cases. Scale bars: 100 μm.
Figure 4.
Figure 4.. Membrane properties of neurons transduced with second-generation rabies viral vectors remain normal for at least eight weeks.
(a) Confocal images of basolateral amygdala neurons projecting to the nucleus accumbens retrogradely labeled with either retrobeads (RB, left panels), first generation rabies virus expressing Cre (ΔG, middle panels), or second generation of rabies virus expressing Cre (ΔGL, right panels), imaged after targeted whole-cell recording. (b) Representative traces of a seal test response in voltage-clamp, and (c) a ramp test to induce action potential firing in current-clamp mode. (d) The series resistance (Rs), capacitance (Cm), membrane resistance (Rm), decay time constant (Tau), and (e) holding current at −70 mV were not different between the three experimental groups (one-way ANOVA, F(2,36)=2.51, p=0.096 (Rs); F(2,36)=1.35, p=0.27 (Cm); F(2,36)=1.38, p=0.26 (Rm); F(2,36)=0.126, p=0.88 (Tau) – n=13(RB), 15(ΔG), and 11(ΔGL); one-way ANOVA, F(2,35)=3.14, p=0.056 (holding current) – n=13(RB), 14(ΔG), and 11(ΔGL)). (f) The action potential (AP) threshold was significantly more negative for the surviving cells transduced with the first generation RV compared to cells containing RB while cells transduced with the second generation RV did not show a difference compared to RB containing cells (one-way ANOVA, F(2,36)=4.29, *p=0.021, RB vs ΔG **p<0.05, RB vs ΔGL p>0.05; n=13(RB), 15(ΔG), and 11 (ΔGL)). The minimal current necessary to induce firing (rheobase) was not significantly different between the three groups (one-way ANOVA, F(2,36)=0.531, p=0.59; n=13(RB), 15(ΔG), and 11(ΔGL)). All bar graphs display mean ± s.e.m. Experiments in this figure were performed in 6 animals with similar results in all cases.
Figure 5.
Figure 5.. In vivo two-photon calcium imaging using GCaMP6f shows that cortical neurons transduced with second-generation rabies viral vectors retain stable visual response properties for at least 4 months.
(a) Calcium imaging from layer 2/3 of primary visual cortex (V1) in two Cre-dependent GCaMP6f reporter mice, 16 weeks after injection of second-generation virus RVΔGL-Cre. The FOVs (center) are maximum intensity projections of the imaging time series. The curves to the right and left of each FOV show example direction tuning curves of single cells (circled), obtained with drifting gratings presented at 8 directions of motion and 5 temporal frequencies (TF), repeated 15 times (mean ΔF/F ± s.e.m.). Labels on leftmost plots in (b) apply to all plots in (a,b). Tuning curves were consistently responsive with clear direction preferences, as expected in V1. All cells bright enough to be segmented from the max projection showed at least spontaneous activity; bright-inactive cells were never seen in the RVΔGL-Cre cases. (b) Calcium imaging from layer 2/3 of V1, 16 weeks after injection of second-generation virus RVΔGL-Cre. While there are cells that show consistent direction preferences (lower curves) or spontaneous activity, there also appear bright cells with no activity of any kind (upper curves). Scale bar: 100 μm. (c) Single-cell fluorescence time courses for the 16 cells with highest mean luminance in each FOV in (a,b) (normalized within FOV, sorted top to bottom from least to most bright), showing the first 150 seconds of visual stimulation. The first and second panels (second generation, RVΔGL-Cre) show robust spontaneous and evoked activity. The third panel (first generation, RVΔG-Cre) explicitly shows the pathology described in (b), with the brightest cells being completely inactive, consistent with previous reports that cells with the highest baseline GCaMP fluorescence and filled-in appearance (no nuclear exclusion) often show altered or reduced activity,. Scale bar: 20 s. (d) Proportions of bright-inactive cells across the RVΔGL-Cre (3 mice, 9 FOVs) and RVΔG-Cre (2 mice, 6 FOVs) populations, for weeks 2 and 8 (horizontal axis labels shared with (f,g)). Cells in the upper 50% of mean fluorescence for each FOV are shown, since poorly labeled GCaMP6f cells with no activity are often too dim to unambiguously segment, and the altered response properties associated with unhealthy RVΔG-Cre-labeled cells are observed in the brightest cells. None of the RVΔGL-Cre cells from week 2 (0 of 502 cells) or week 8 (0 of 717) were inactive, measured over the full 30 minutes of visual stimulation. Inactive cells were noticed as early as week 2 in the RVΔG-Cre condition (1 of 142, 0.7%) and increased significantly by week 8 (10 of 139, 7.2%; two-sample z-score proportion test, z=2.81, p = **5.2×10⁻³). (e) Example calcium time courses from week 16 (top left: RVΔGL-Cre; middle right and bottom left: RVΔG-Cre). Raw time courses (gray) of active cells can generally be approximated by an autoregressive (AR) process of order 1 (see Methods; inferred trace offset, in red). The bottom RVΔG-Cre time course comes from an aberrant cell with a slow, sustained increase in brightness that is not well fit by the AR model, and very sparse activity otherwise. This is distinct from the bright-inactive cells shown in (c) but may be part of the same progression toward inactivity or cell death. The two RVΔG-Cre examples come from the same FOV, within a hundred microns of each other, suggesting that the prolonged changes in fluorescence cannot be accounted for by z-motion artifacts. There were 13 such sustained-activity cells out of 46 (28.3 %) segmented in the AR analysis of week-8 RVΔG-Cre cells. Vertical scale bar, ΔF/F: 3.0 (1.2, 0.3) for top (middle, bottom) traces. Horizontal scale bar: 20 s. (f) Peak ΔF/F across the RVΔG-Cre and RVΔGL-Cre population, for weeks 2 and 8. The mean (± s.e.m) of RVΔGL-Cre cells decreased significantly from week 2 (3.95 ± 0.17, n=191) to week 8 (3.47 ± 0.14, n=247; two-sided unpaired t(436)=2.25, *p =0.025) as baseline fluorescence gradually increased to final levels, but did not change significantly for the more rapidly expressing RVΔG-Cre cells between week 2 (2.46 ±0.20, n=44) and week 8 (2.71 ± 0.24, n=33; t(75)=0.81, p=0.42). (g) Decay time constant (τ) of calcium transients across the RVΔG-Cre and RVΔGL-Cre population, for weeks 2 and 8. The mean τ of RVΔGL-Cre cells did not increase significantly from week 2 (1.07 ± 0.02 s, n=191) to week 8 (1.12 ± 0.02 s, n= 247; two-sided unpaired t(436)=1.72, p=0.086). For RVΔG-Cre cells, τ showed a pronounced increase from week 2 (0.99 ± 0.05 s, n=44) to week 8 (1.27 ± 0.08 s, n=33; t(75)=3.31, **p=0.0014). Sustained-activity cells were excluded from the analysis, so the large increase in τ in RVΔG-Cre cells likely underestimates the extent of changes in the RVΔG-Cre population. Data are represented as box plots showing mean (large points), median (horizontal line), 25th-75th percentile (boxes, IQR), 1.5xIQR above or below 75th or 25th percentiles (whiskers), and outliers beyond this range (small points).
Figure 6.
Figure 6.. Second-generation rabies viral vectors retrogradely infect more types of corticocortical cells than either canine adenoviral or rAAV2-retro vectors.
CAV2-Cre (a,b), RVΔGL-Cre (c,d), or rAAV2-retro-EF1a-Cre (e) was injected into anterior cingulate area (ACA) of Ai75 mice so that cells across the brain which provide input to ACA were labeled via Cre-induced nuclear tdTomato expression. The approximate center of the injection site for each experiment is shown in (a(i)e(i)) (left side of images). Most brain regions containing retrogradely labeled cells from ACA were consistently identified across all three types of virus experiments, with at least one notable exception (CA1 contained labeled cells in RVΔGL-Cre, (c(v),d(v)). However, within the same areas, specifically in the cortex, we observed differences suggesting tropism or other biases in the specific types of neurons labeled. For example, labeled input cells in the contralateral ACA (boxes in row i indicate panels enlarged in row ii) were seen predominantly in layer 5 (L5) for CAV2-Cre (a(ii),b(ii)), but are located more uniformly across layers with RVΔGL-Cre (c(ii),d(ii)) and AAV-retro-EF1a-Cre (e(ii)). Similar differences between Cre+ input cells across layers were observed in most cortical areas, including ventrolateral orbital cortex (ORBvl, a(iii)-e(iii)), retrosplenial cortex (RSP, a(iv)-e(iv) and a(v)-e(v)), and anterolateral visual cortex (VISal, a(v)-e(v), a(vi)-e(vi)). Quantification of the number of labeled cells per layer indicated that, in all cases, CAV2-Cre labeling is biased toward L5 neurons, whereas RV-ΔGL-Cre results in input cells labeled across all layers providing long-range inter-areal inputs (L2/3, L5, L6; a(vii)-e(vii)). In contrast to RVΔGL-Cre and CAV2-Cre in VISal and RSP, AAV-retro-EF1a-Cre appeared to be biased towards L2/3, with only sparse labeling in L5 (c(vii) and d(vii)). Cre+ input cells were also observed in subcortical structures, including several thalamic nuclei (e.g. mediodorsal nucleus (MD), posterior complex (PO), and the central lateral nucleus (CL), seen in (iv), consistent with known connectivity of ACA. The more prominent labeling in RVΔGL-Cre and AAV-retro-EF1a-Cre cases in the thalamus (c(iv)-e(iv)) may be due to true differences in efficiency between viruses, or in the amount of viral uptake for each experiment; further experiments are necessary to explore this observation. Images in (a,b) were acquired by serial 2-photon tomography. Images in (ce) were acquired by epifluorescence microscopy and sections counterstained with DAPI (blue). Graphs in (a(vii)-d(vii)) show the mean and full range of values (min to max, n=2 independent experiments for CAV2-Cre and RVΔGL-Cre;n=1 experiment for AAV-retro-EF1a-Cre). Boxplots in (e(vii)) indicate the median and full range (min to max) in all four regions from (a(vii)-d(vii)) (n=5 independent experiments). Scale bars: rows i,iii-v = 1 mm; rows ii,vi = 500 μm.

References

    1. Wickersham IR, Finke S, Conzelmann KK & Callaway EM Retrograde neuronal tracing with a deletion-mutant rabies virus. Nature Methods 4, 47–9 (2007). - PMC - PubMed
    1. Wickersham IR et al. Monosynaptic restriction of transsynaptic tracing from single, genetically targeted neurons. Neuron 53, 639–47 (2007). - PMC - PubMed
    1. Wall NR, Wickersham IR, Cetin A, De La Parra M & Callaway EM Monosynaptic circuit tracing in vivo through Cre-dependent targeting and complementation of modified rabies virus. Proceedings of the National Academy of Sciences of the United States of America (2010). - PMC - PubMed
    1. Marshel JH, Mori T, Nielsen KJ & Callaway EM Targeting single neuronal networks for gene expression and cell labeling in vivo. Neuron 67, 562–74 (2010). - PMC - PubMed
    1. Rancz EA et al. Transfection via whole-cell recording in vivo: bridging single-cell physiology, genetics and connectomics. Nature neuroscience (2011). - PMC - PubMed

Publication types

MeSH terms

Substances