. 2018 Apr;21(4):497-505.
doi: 10.1038/s41593-018-0101-9. Epub 2018 Mar 5.

Dysregulation of the epigenetic landscape of normal aging in Alzheimer's disease

Affiliations

Dysregulation of the epigenetic landscape of normal aging in Alzheimer's disease

Raffaella Nativio et al. Nat Neurosci. 2018 Apr.

Erratum in

Abstract

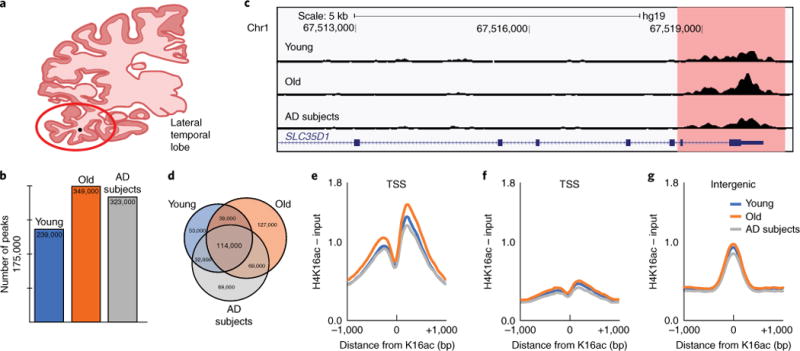
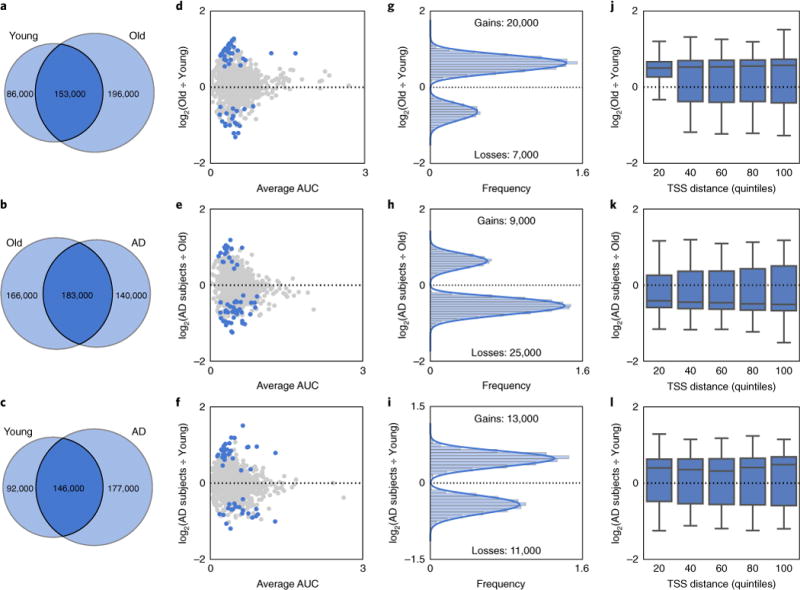
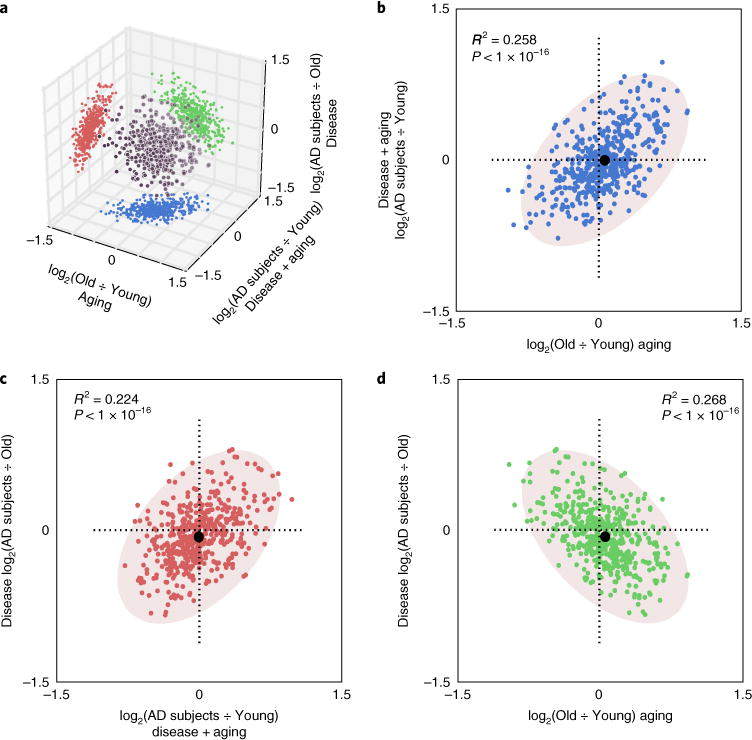
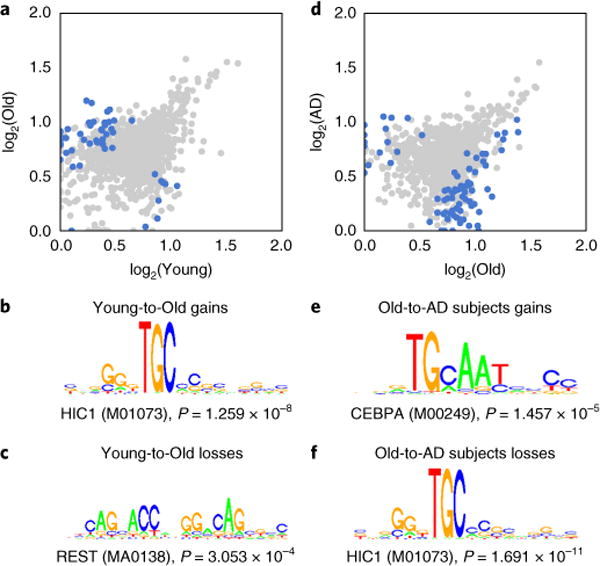
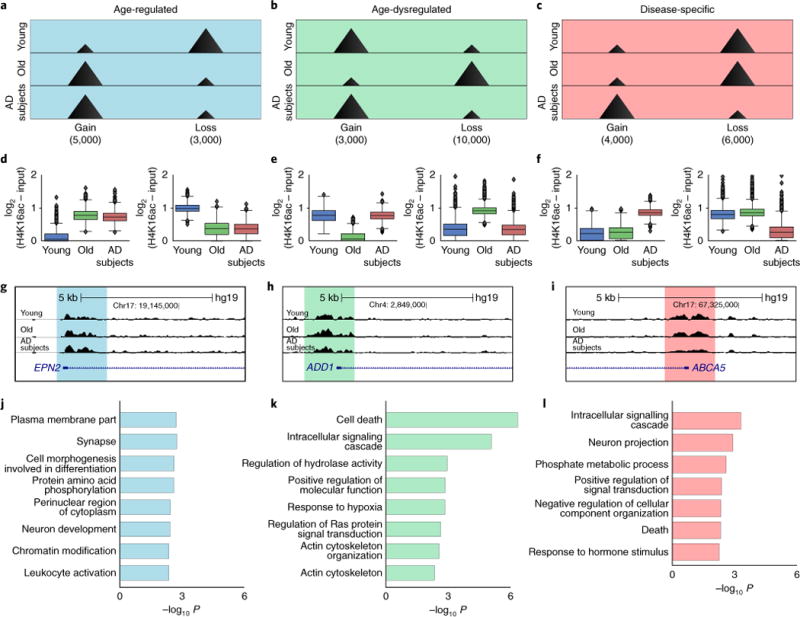
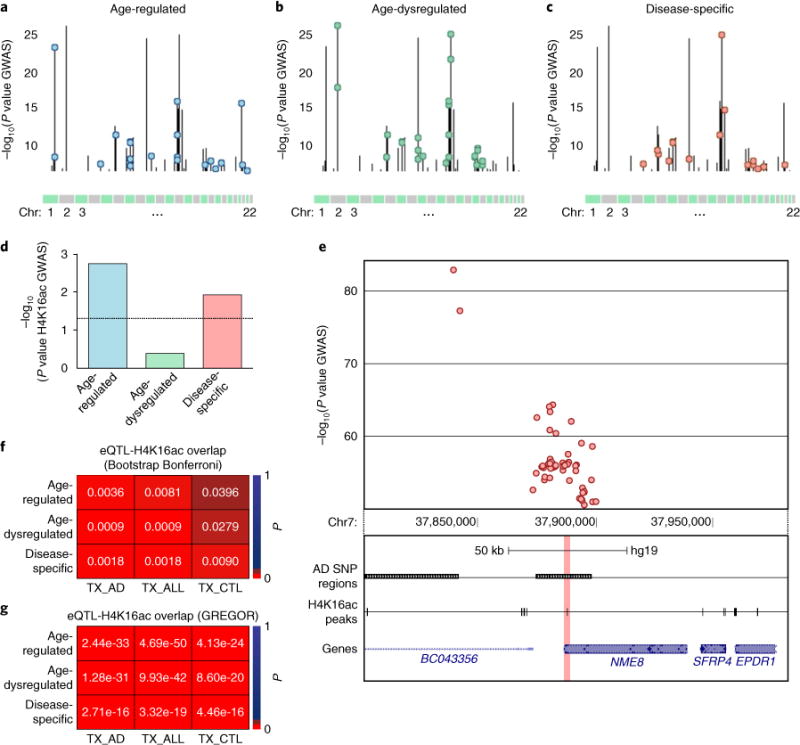
Aging is the strongest risk factor for Alzheimer's disease (AD), although the underlying mechanisms remain unclear. The chromatin state, in particular through the mark H4K16ac, has been implicated in aging and thus may play a pivotal role in age-associated neurodegeneration. Here we compare the genome-wide enrichment of H4K16ac in the lateral temporal lobe of AD individuals against both younger and elderly cognitively normal controls. We found that while normal aging leads to H4K16ac enrichment, AD entails dramatic losses of H4K16ac in the proximity of genes linked to aging and AD. Our analysis highlights the presence of three classes of AD-related changes with distinctive functional roles. Furthermore, we discovered an association between the genomic locations of significant H4K16ac changes with genetic variants identified in prior AD genome-wide association studies and with expression quantitative trait loci. Our results establish the basis for an epigenetic link between aging and AD.


Conflict of interest statement

Competing interests

The authors declare no competing interests.

Figures

Fig. 1
Fig. 1. H4K16ac is redistributed during normal aging and AD
a, Coronal section of human brain indicating the lateral temporal lobe (red circle) used in this study. b, Bar plot of total number of H4K16ac peaks. c, UCSC Genome browser track view of H4K16ac peak at the SLC35D1 gene promoter in Young, Old and AD subjects. d, Venn diagram of peak overlap among Young, Old and AD subjects. eg, Meta-profile of H4K16ac enrichment at (e) TSSs (±1 kb) of constitutive peaks; (f) TSS (±1 kb) where no peak is detected; and (g) intergenic constitutive peaks (peaks shared across Young, Old and AD subjects).
Fig. 2
Fig. 2. H4K16ac is predominantly gained in aging and lost in AD
ac, Venn diagram of H4K16ac peak overlap between Young and Old (a), Old and AD subjects (b), and Young and AD subjects (c). df, Scatter plot of H4K16ac fold-change vs. peak size average (measured as area under the curve or AUC) for (d) Young vs. Old, (e) Old vs. AD subjects and (f) Young vs. AD subjects comparisons for peaks called in Young, Old or AD subjects. Blue dots represent peaks with significant changes (P < 0.05, Welch’s t test, two-sided) in H4K16ac enrichment. For graphical representation, 1,000 randomly chosen points are shown in each panel. gi, Histogram of H4K16ac fold-change vs. frequency for peaks with significant (P < 0.05, Welch’s t test, two-sided) H4K16ac changes (blue dots in df) for (g) Young vs. Old, (h) Old vs. AD subjects and (i) Young vs. AD subjects comparisons. jl, Boxplot of H4K16ac fold-changed based on the distance of the peak from the closest TSS ordered into quintiles for peaks with significant (P < 0.05, Welch’s t test, two-sided) H4K16ac changes (blue dots in df) for (j) Young to Old, (k) Old to AD subjects and (l) Young to AD subjects comparisons. Boxplots show minimum, first quartile, median (center line), third quartile and maximum.
Fig. 3
Fig. 3. H4K16ac changes between aging and AD are negatively correlated
a, 3D scatter plot showing the correlations between H4K16ac changes during aging (Young-to-Old), disease (Old-to-AD subjects) and aging mixed with disease (Young-to-AD subjects) for all H4K16ac peaks detected in the three groups (black dots). Projections on the 2D orthogonal subspaces represent pairwise comparison of the three processes (blue, red and green dots), which are enlarged in panels bd. bd, Scatter plot shows correlation between H4K16ac changes in (b) Aging and Disease + aging (positive correlation), (c) Disease + aging and Disease (positive correlation) and (d) Aging and Disease (negative correlation). For graphical representation, 500 randomly chosen points are shown in each case. Pearson correlation coefficient for the entire dataset is indicated. Black dots in bd represent centroids of underlying ovals.
Fig. 4
Fig. 4. The HiC1 motif is enriched in both H4K16ac gains during aging and H4K16ac losses in AD
a,d, Scatter plot showing H4K16ac peak enrichment (measured as AUC) between (a) Young and Old and (d) Old and AD subjects for peaks detected in each of the three groups. Blue dots represent peaks with significant H4K16ac changes (P < 0.05, Welch’s t test, two-sided). For graphical representation, 1,000 randomly chosen points are shown in each case. b,c,e,f, Top DNA motifs from SeqPos analysis are shown for peak regions with significant (P < 0.05, Welch’s t test, two-sided) H4K16ac (b) gains or (c) losses in aging (Young-to-Old comparison) and H4K16ac (e) gains or (f) losses in AD (Old-to-AD subjects comparison; within top 6 DNA motifs by significance) within 1 kb from TSS.
Fig. 5
Fig. 5. Three classes of H4K16ac changes detected in AD
ac, Peak schematic of the three classes of H4K16ac changes in AD: (a) age-regulated, (b) age-dysregulated and (c) disease-specific. Each class is further separated into two subclasses based on H4K16ac gains or losses in AD. The number of significant gains or losses (P < 0.05, one-way ANOVA) in each defined subclass is reported below the schematic. df, Box-plots of H4K16ac enrichment in each subclass reported in ac. Boxplots show minimum, first quartile, median (center line), third quartile and maximum. Outliers are represented as black dots. gi, Representative UCSC Genome browser track views of H4K16ac changes defined above. Chr, chromosome. jl, Bar plot of top eight GO terms (Biological Process and Cellular component; DAVID Bioinformatics Resources v6.7) in each of the three classes of H4K16ac changes with at least 20 genes per term and false discovery rate (FDR) < 10%.
Fig. 6
Fig. 6. AD GWAS SNPs and AD eQTLs are strongly associated with regions of H4K16ac changes
ac, Manhattan plots showing the 260 AD SNP regions (vertical lines) in all chromosomes overlapped with H4K16ac changes (color-coded circles) for each of the three classes in Fig. 5a–c. The y axis indicates the −log10(P) of the SNP with the strongest AD association within each SNP region (P values are from the International Genomics of Alzheimer’s project (IGAP)). d, Bar plot showing the significance (−log10(P)) of the association between the AD SNP regions and each of the three classes of H4K16ac changes assessed by INRICH. Black dotted horizontal line denotes the threshold of significance (P < 0.05). e, Representative UCSC Genome browser track view showing a cluster of AD SNPs (top) within a SNP region associated with disease-specific class of H4K16ac change (bottom; highlighted in pink) at the NME8 locus. f, Heatmap of Bonferroni adjusted P values for sampling-based analysis of H4K16ac peak overlap (three classes of changes) with temporal cortex (TX) eQTLs from Zou et al. eQTLs are split into those from AD cases (TX_AD), non-AD but with other brain pathologies (TX_CTL), and combined conditions (TX_ALL). g, Overlap analysis with TX eQTLs from Zou et al. using GREGOR.

Comment in

References

    1. Toledo JB, et al. Alzheimer’s disease cerebrospinal fluid biomarker in cognitively normal subjects. Brain. 2015;138:2701–2715. - PMC - PubMed
    1. Alzheimer’s Association. 2015 Alzheimer’s disease facts and figures. Alzheimers Dement. 2015;11:332–384. - PubMed
    1. Sen P, Shah PP, Nativio R, Berger SL. Epigenetic mechanisms of longevity and aging. Cell. 2016;166:822–839. - PMC - PubMed
    1. Kawahara TL, et al. SIRT6 links histone H3 lysine 9 deacetylation to NF-kappaB-dependent gene expression and organismal life span. Cell. 2009;136:62–74. - PMC - PubMed
    1. Gräff J, Tsai LH. Histone acetylation: molecular mnemonics on the chromatin. Nat Rev Neurosci. 2013;14:97–111. - PubMed

Publication types