. 2018 Feb 2;8(5):1340-1349.
doi: 10.7150/thno.22806. eCollection 2018.

Desmin- and vimentin-mediated hepatic stellate cell-targeting radiotracer 99mTc-GlcNAc-PEI for liver fibrosis imaging with SPECT

Affiliations

Desmin- and vimentin-mediated hepatic stellate cell-targeting radiotracer 99mTc-GlcNAc-PEI for liver fibrosis imaging with SPECT

Deliang Zhang et al. Theranostics. .

Abstract

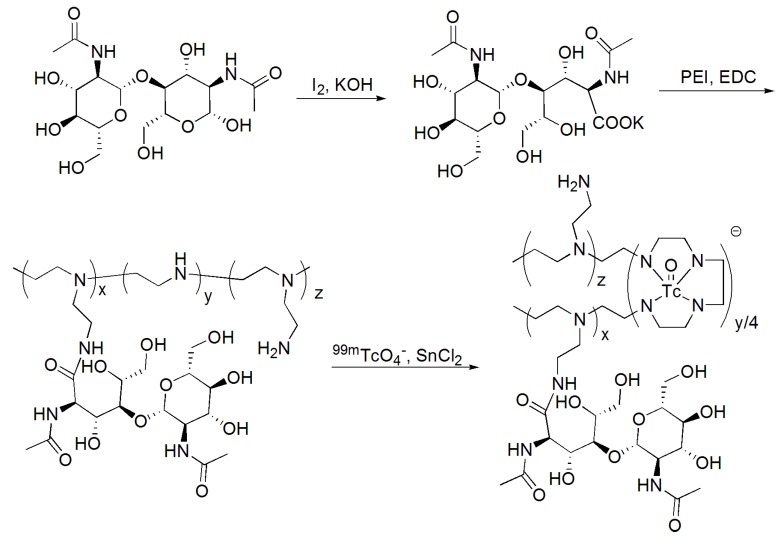
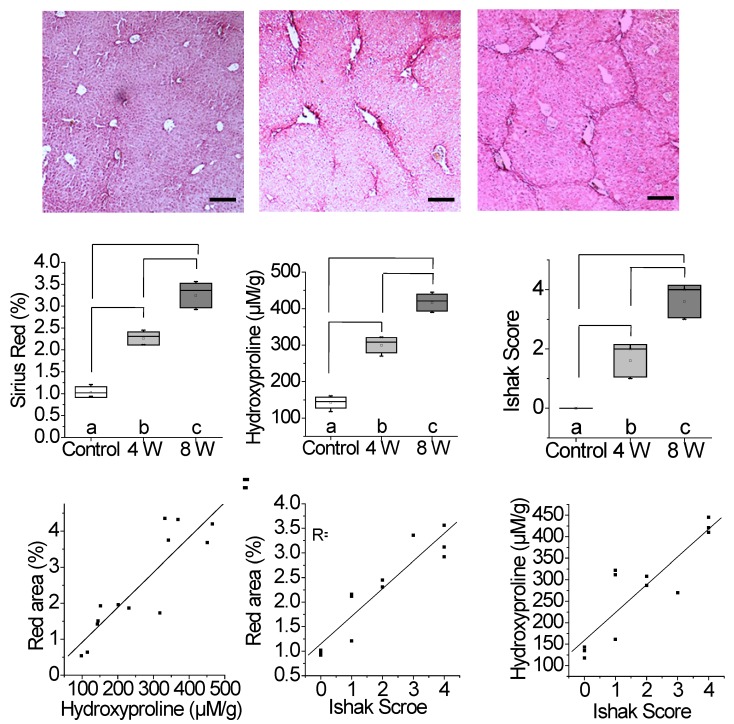
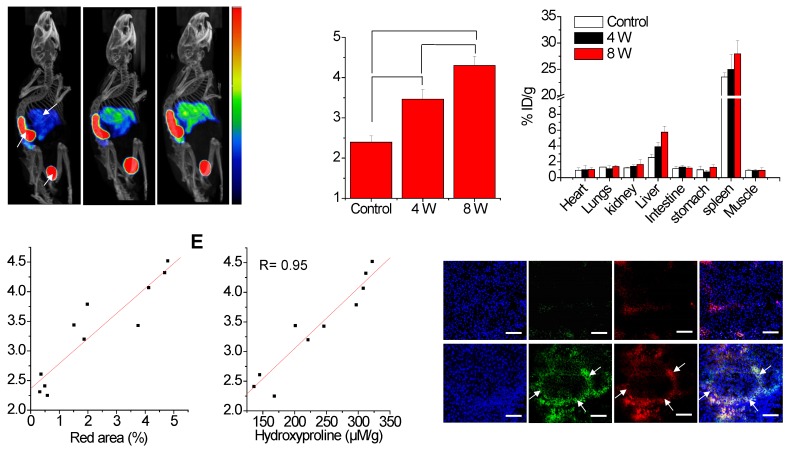
Extracellular matrix (ECM) accumulation in liver fibrosis is caused by the activation of hepatic stellate cells (HSCs). The goal of this study was to develop a 99mTc-labeled N-acetylglucosamine (GlcNAc) that specifically interacts with desmin and vimentin expressed on activated HSCs to monitor the progression and prognosis of liver fibrosis using single-photon emission computed tomography (SPECT) imaging. Methods: GlcNAc-conjugated polyethylenimine (PEI) was first prepared and radiolabeled with 99mTc. Noninvasive SPECT imaging with 99mTc-GlcNAc-PEI was used to assess liver fibrosis in a carbon tetrachloride (CCl4) mouse model. The liver uptake value (LUV) of 99mTc-GlcNAc-PEI was measured by drawing the region of interest (ROI) of the whole liver as previously suggested. The LUV of the CCl4 groups was compared with that of the olive oil group. Next, we estimated the correlation between the results of SPECT imaging and physiological indexes. After treatment with clodronate liposome, the LUV of 99mTc-GlcNAc-PEI in fibrotic mice was compared with that in control mice. Results:99mTc-GlcNAc-PEI is a hydrophilic compound with high radiochemical purity (>98%) and good stability. It could specifically target desmin and vimentin on the surface of activated HSCs with high affinity (the Kd values were 53.75 ± 9.50 nM and 20.98 ± 3.56 nM, respectively). The LUV of 99mTc-GlcNAc-PEI was significantly different between the CCl4 and control groups as early as 4 weeks of CCl4 administration (3.30 ± 0.160 vs 2.34 ± 0.114%/cc; P ˂ 0.05). There was a strong correlation between the LUV and Sirius Red quantification (R = 0.92, P ˂ 0.001). Compared with control, clodronate liposome treatment reduced the LUV of 99mTc-GlcNAc-PEI (4.62 ± 0.352 vs 2.133 ± 0.414%/cc; P ˂ 0.05). Conclusion:99mTc-GlcNAc-PEI SPECT/CT was useful in assessing liver fibrosis and monitoring the treatment response.

Keywords: 99mTc-GlcNAc-PEI; SPECT imaging; desmin; hepatic fibrosis; hepatic stellate cells; vimentin.


Conflict of interest statement

Competing Interests: The authors have declared that no competing interest exists.

Figures

Fig 1
Fig 1
Synthesis and radiolabeling of GlcNAc-PEI with 99mTc.
Fig 2
Fig 2
Characterization of a CCl4-induced mouse model of liver fibrosis. (A) Representative images of Sirius Red staining after CCl4 administration for 4 or 8 weeks. Scale bar: 200 μm. (B) Red area of Sirius Red staining was quantified using Image pro-pus software. (C) Hydroxyproline level in the liver of CCl4-induced mice was calculated by HPLC analysis. (D) Ishak score of the liver tissue in CCl4-induced fibrotic mice. (E) Correlation between total collagen (hydroxyproline) and red area of Sirius Red staining. (F) Correlation between the total Ishak score and red area of Sirius Red staining. (G) Correlation between the Ishak score and total collagen (hydroxyproline). *P <0.05 and **P <0.01.
Fig 3
Fig 3
MicroSPECT/CT imaging with 99mTc-GlcNAc-PEI to assess liver fibrosis. (A) SPECT/CT imaging of CCl4-induced fibrotic mice with 99mTc-GlcNAc-PEI. Both images were rendered at the same scale. (B) Hepatic uptake of control and fibrotic mice by drawing the ROI of the whole liver. (C) Biodistribution of 99mTc-GlcNAc-PEI in CCl4-induced fibrotic mice (n = 3). (D) Correlation between hepatic uptake and Sirius Red quantification. (E) Correlation between hepatic uptake and total collagen (hydroxyproline). (F) Immunofluorescence co-localization analysis of desmin and GlcNAc-PEI-Cy5.5 in the liver tissue of CCl4-induced fibrotic mice. Scale bar: 200 μm. *P <0.05 and **P <0.01.
Fig 4
Fig 4
Blocking studies of 99mTc-GlcNAc-PEI in fibrotic mice. (A) SPECT/CT imaging of fibrotic mice at 30 min after the intravenous injection of 99mTc-GlcNAc-PEI (18.5 MBq) with or without GlcNAc-PEI for blocking. Images were adjusted using the same scale for all animals. (B) Cell uptake of GlcNAc-PEI-Cy5.5 in the fibrotic liver tissue. Blue: DAPI; Red: GlcNAc-PEI-Cy5.5. Scale bar: 50 μm. (C) Hepatic uptake of 99mTc-GlcNAc-PEI derived from SPECT imaging by drawing the ROI of the whole liver. (D) Competitive binding assay of 99mTc-GlcNAc-PEI with or without the presence of excess GlcNAc-PEI in HSCs separated from the liver of fibrotic mice. (E) Saturation binding assay of 99mTc-GlcNAc-PEI with desmin protein.
Fig 5
Fig 5
99mTc-GlcNAc-PEI SPECT/CT imaging of liver fibrosis mice with clodronate liposome treatment. (A) 99mTc-GlcNAc-PEI SPECT/CT imaging of fibrotic mice with clodronate liposome treatment. (B) Hepatic uptake of 99mTc-GlcNAc-PEI by drawing the ROI of the whole liver. (C) Representative images of Sirius Red staining after clodronate liposome treatment. Scale bar: 200 μm. (D) Quantization of the red area of Sirius Red staining after treatment with clodronate liposome. (E) Hydroxyproline level in the liver of CCl4-induced mice after treatment with clodronate liposomes. (F) Immunofluorescence staining of fibrotic liver tissue after treatment with clodronate liposome. Blue: DAPI; green: anti-CD68 staining FITC; Red: GlcNAc-PEI-Cy5.5. Scale bar: 200 μm. *P <0.05 and **P <0.01.

Similar articles

Cited by

References

    1. Friedman SL. Mechanisms of hepatic fibrogenesis. Gastroenterology. 2008;134:1655–1669. - PMC - PubMed
    1. Bataller R, Brenner DA. Liver fibrosis. J Clin Invest. 2005;115:209–218. - PMC - PubMed
    1. Guido M, Rugge M, Chemello L. et al. Liver stellate cells in chronic viral hepatitis: the effect of interferon therapy. J Hepatol. 1996;24:301–307. - PubMed
    1. Friedman SL. Liver fibrosis - from bench to bedside. J Hepatol. 2003;38:38–53. - PubMed
    1. Reeves HL, Burt AD, Wood SJ. et al. Hepatic stellate cell activation occurs in the absence of hepatitis in alcoholic liver disease and correlates with the severity of steatosis. J Hepatol. 1996;25:677–683. - PubMed

Publication types

MeSH terms