

Integrated analyses of multi-omics reveal global patterns of methylation and hydroxymethylation and screen the tumor suppressive roles of HADHB in colorectal cancer
- PMID: 29507648
- PMCID: PMC5833094
- DOI: 10.1186/s13148-018-0458-3
Integrated analyses of multi-omics reveal global patterns of methylation and hydroxymethylation and screen the tumor suppressive roles of HADHB in colorectal cancer
Abstract
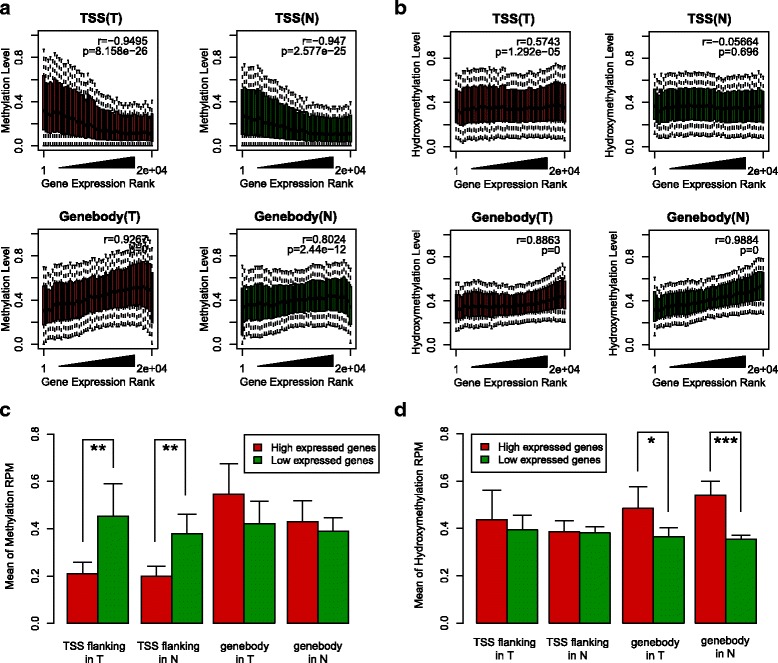
Background: DNA methylation is an important epigenetic modification, associated with gene expression. 5-Methylcytosine and 5-hydroxymethylcytosine are two epigenetic hallmarks that maintain the equilibrium of epigenetic reprogramming. Disequilibrium in genomic methylation leads to carcinogenesis. The purpose of this study was to elucidate the epigenetic mechanisms of DNA methylation and hydroxymethylation in the carcinogenesis of colorectal cancer.
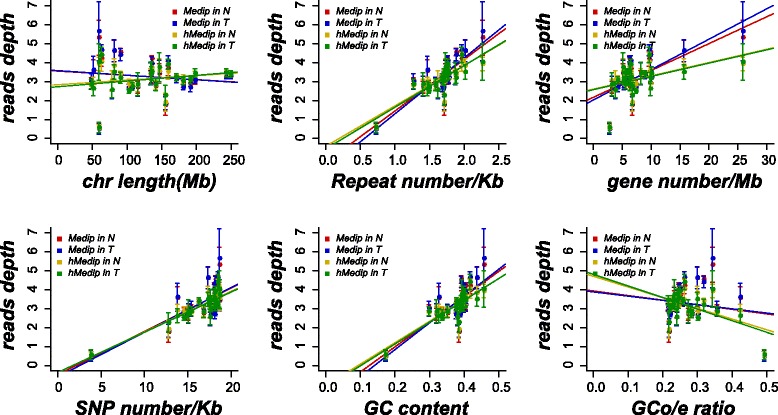
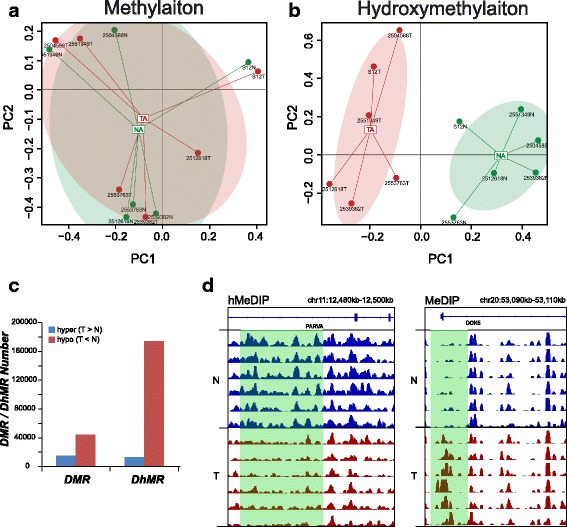
Methods: Genome-wide patterns of DNA methylation and hydroxymethylation in six paired colorectal tumor tissues and corresponding normal tissues were determined using immunoprecipitation and sequencing. Transcriptional expression was determined by RNA sequencing (RNA-Seq). Groupwise differential methylation regions (DMR), differential hydroxymethylation regions (DhMR), and differentially expressed gene (DEG) regions were identified. Epigenetic biomarkers were screened by integrating DMR, DhMR, and DEGs and confirmed using functional analysis.
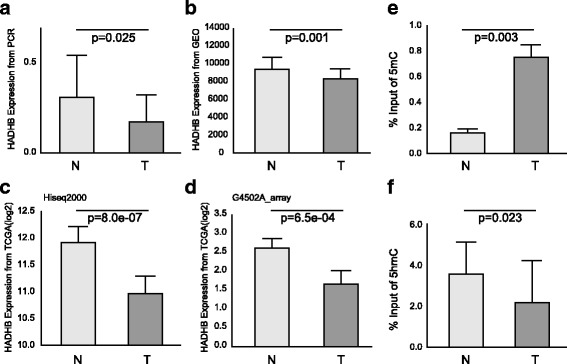
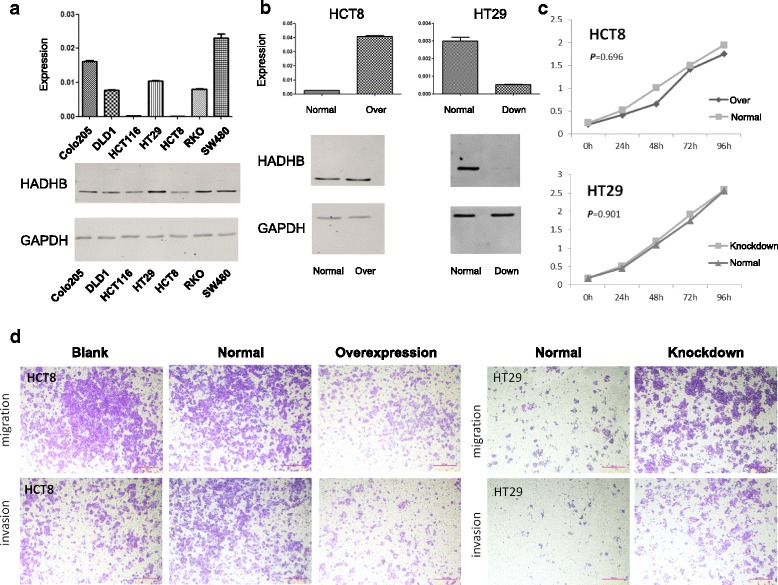
Results: We identified a genome-wide distinct hydroxymethylation pattern that could be used as an epigenetic biomarker for clearly differentiating colorectal tumor tissues from normal tissues. We identified 59,249 DMRs, 187,172 DhMRs, and 948 DEGs by comparing between tumors and normal tissues. After cross-matching genes containing DMRs or DhMRs with DEGs, we screened seven genes that were aberrantly regulated by DNA methylation in tumors. Furthermore, hypermethylation of the HADHB gene was persistently found to be correlated with downregulation of its transcription in colorectal cancer (CRC). These findings were confirmed in other patients of colorectal cancer. Tumor functional analysis indicated that HADHB reduced cancer cell migration and invasiveness. These findings suggested its possible role as a tumor suppressor gene (TSG).
Conclusion: This study reveals the global patterns of methylation and hydroxymethylation in CRC. Several CRC-associated genes were screened with multi-omic analysis. Aberrant methylation and hydroxymethylation were found to be in the carcinogenesis of CRC.
Keywords: Colorectal cancer; DNA hydroxymethylation; DNA methylation; Epigenetic; Sequencing.
Conflict of interest statement
Not applicableThe authors declare that they have no competing interests.Springer Nature remains neutral with regard to jurisdictional claims in published maps and institutional affiliations.
Figures
Similar articles
-
Filtrating colorectal cancer associated genes by integrated analyses of global DNA methylation and hydroxymethylation in cancer and normal tissue.Sci Rep. 2016 Aug 22;6:31826. doi: 10.1038/srep31826. Sci Rep. 2016. PMID: 27546520 Free PMC article.
-
Epigenetic profiling and mRNA expression reveal candidate genes as biomarkers for colorectal cancer.J Cell Biochem. 2019 Jun;120(6):10767-10776. doi: 10.1002/jcb.28368. Epub 2019 Jan 22. J Cell Biochem. 2019. PMID: 30672027
-
Characterization of DNA hydroxymethylation profile in cervical cancer.Artif Cells Nanomed Biotechnol. 2019 Dec;47(1):2706-2714. doi: 10.1080/21691401.2019.1634578. Artif Cells Nanomed Biotechnol. 2019. PMID: 31271297
-
DNA methylation patterns as noninvasive biomarkers and targets of epigenetic therapies in colorectal cancer.Epigenomics. 2016 May;8(5):685-703. doi: 10.2217/epi-2015-0013. Epub 2016 Apr 22. Epigenomics. 2016. PMID: 27102979 Free PMC article. Review.
-
DNA methylation aberrancies delineate clinically distinct subsets of colorectal cancer and provide novel targets for epigenetic therapies.Oncogene. 2018 Feb 1;37(5):566-577. doi: 10.1038/onc.2017.374. Epub 2017 Oct 9. Oncogene. 2018. PMID: 28991233 Free PMC article. Review.
Cited by
-
Multi-Omics Approaches in Colorectal Cancer Screening and Diagnosis, Recent Updates and Future Perspectives.Cancers (Basel). 2022 Nov 11;14(22):5545. doi: 10.3390/cancers14225545. Cancers (Basel). 2022. PMID: 36428637 Free PMC article. Review.
-
Comprehensive Analysis of TICRR in Hepatocellular Carcinoma Based on Bioinformatics Analysis.Biochem Genet. 2024 Feb;62(1):1-17. doi: 10.1007/s10528-023-10378-w. Epub 2023 Jun 2. Biochem Genet. 2024. PMID: 37266876 Free PMC article.
-
Omics technologies as powerful approaches to unravel colorectal cancer complexity and improve its management.Mol Cells. 2025 May;48(5):100200. doi: 10.1016/j.mocell.2025.100200. Epub 2025 Feb 28. Mol Cells. 2025. PMID: 40024318 Free PMC article. Review.
-
Elucidating prognostic significance of purine metabolism in colorectal cancer through integrating data from transcriptomic, immunohistochemical, and single-cell RNA sequencing analysis.Mol Oncol. 2025 Aug;19(8):2310-2329. doi: 10.1002/1878-0261.70010. Epub 2025 Feb 27. Mol Oncol. 2025. PMID: 40017120 Free PMC article.
-
Abnormal expression of HADH, an enzyme of fatty acid oxidation, affects tumor development and prognosis (Review).Mol Med Rep. 2022 Dec;26(6):355. doi: 10.3892/mmr.2022.12871. Epub 2022 Oct 14. Mol Med Rep. 2022. PMID: 36239258 Free PMC article. Review.
References
Publication types
MeSH terms
Substances
LinkOut - more resources
Full Text Sources
Other Literature Sources
Medical
Molecular Biology Databases
Miscellaneous
