. 2018 Feb 4:2018:9649608.
doi: 10.1155/2018/9649608. eCollection 2018.

Nocturnal Hypoxia Improves Glucose Disposal, Decreases Mitochondrial Efficiency, and Increases Reactive Oxygen Species in the Muscle and Liver of C57BL/6J Mice Independent of Weight Change

Affiliations

Nocturnal Hypoxia Improves Glucose Disposal, Decreases Mitochondrial Efficiency, and Increases Reactive Oxygen Species in the Muscle and Liver of C57BL/6J Mice Independent of Weight Change

Simona Ioja et al. Oxid Med Cell Longev. .

Abstract

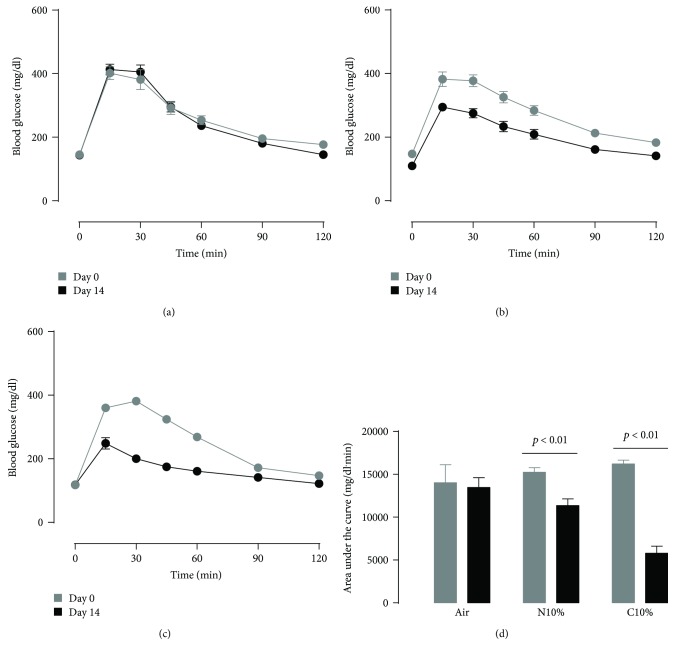
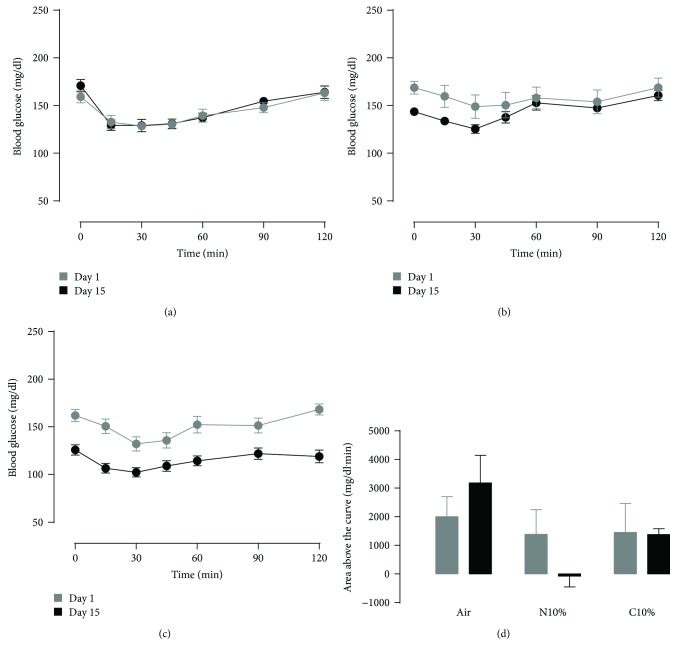
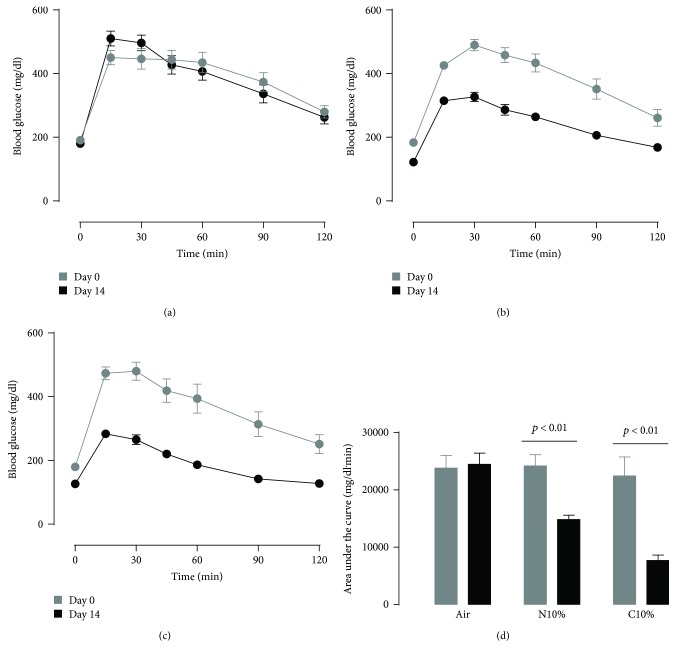
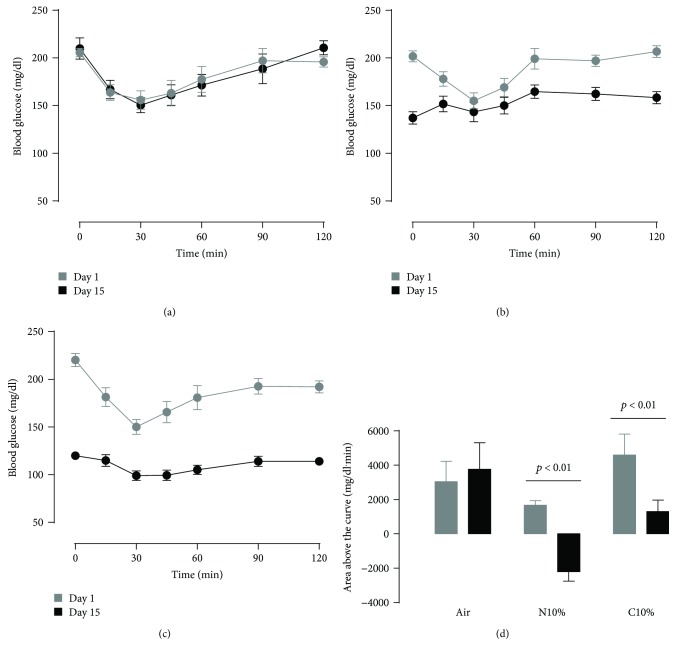
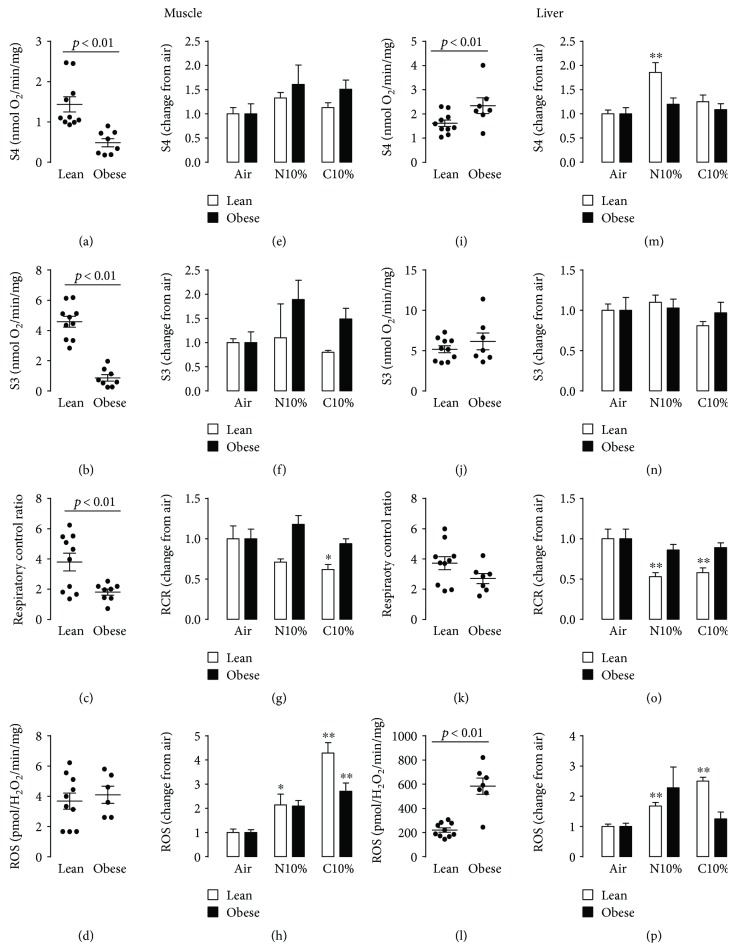
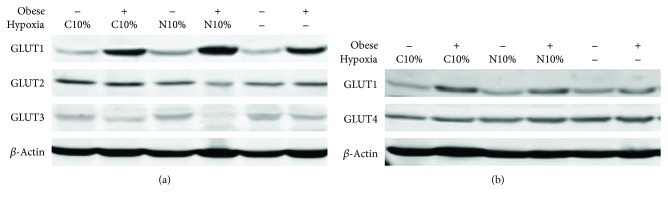
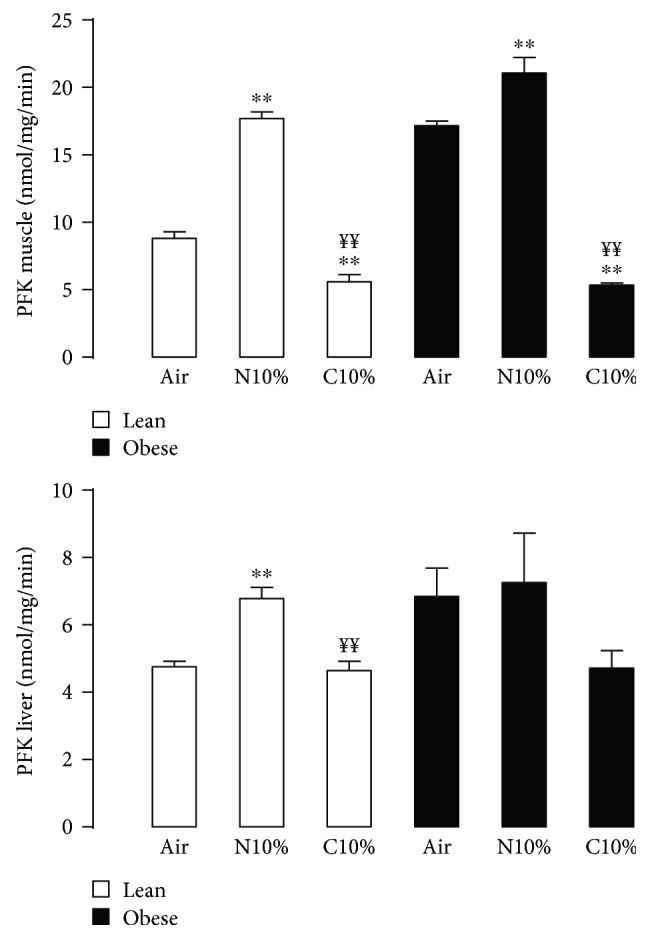
Although acute exposure to hypoxia can disrupt metabolism, longer-term exposure may normalize glucose homeostasis or even improve glucose disposal in the presence of obesity. We examined the effects of two-week exposure to room air (Air), continuous 10% oxygen (C10%), and 12 hr nocturnal periods of 10% oxygen (N10%) on glucose disposal, insulin responsiveness, and mitochondrial function in lean and obese C57BL/6J mice. Both C10% and N10% improved glucose disposal relative to Air in lean and obese mice without evidence of an increase in insulin responsiveness; however, only the metabolic improvements with N10% exposure occurred in the absence of confounding effects of weight loss. In lean mice, N10% exposure caused a decreased respiratory control ratio (RCR) and increased reactive oxygen species (ROS) production in the mitochondria of the muscle and liver compared to Air-exposed mice. In the absence of hypoxia, obese mice exhibited a decreased RCR in the muscle and increased ROS production in the liver compared to lean mice; however, any additional effects of hypoxia in the presence of obesity were minimal. Our data suggest that the development of mitochondrial inefficiency may contribute to metabolic adaptions to hypoxia, independent of weight, and metabolic adaptations to adiposity, independent of hypoxia.


Figures

Figure 1
Figure 1
Lean mice: intraperitoneal glucose tolerance test on day 0 (before) and day 14 (after) exposure to two weeks of (a) room air (Air; n = 10), (b) nocturnal 10% hypoxia (N10%; n = 7), and (c) continuous 10% hypoxia (C10%; n = 8) and (d) corresponding mean ± s.e.m. area under the glucose curve. Statistical differences marked by horizontal lines determined by two-tailed paired t-test.
Figure 2
Figure 2
Lean mice: intraperitoneal insulin tolerance test on day 0 (before) and day 14 (after) exposure to two weeks of (a) room air (Air; n = 10), (b) nocturnal 10% hypoxia (N10%; n = 7), and (c) continuous 10% hypoxia (C10%; n = 8) and (d) corresponding mean ± s.e.m. area under the glucose curve.
Figure 3
Figure 3
Obese mice: intraperitoneal glucose tolerance test on day 0 (before) and day 14 (after) exposure to two weeks of (a) room air (Air; n = 7), (b) nocturnal 10% hypoxia (N10%; n = 9), and (c) continuous 10% hypoxia (C10%; n = 11), and (d) corresponding mean ± s.e.m. area above the glucose curve. Statistical differences marked by horizontal lines determined by two-tailed paired t-test.
Figure 4
Figure 4
Obese mice: intraperitoneal insulin tolerance test on day 0 (before) and day 14 (after) exposure to two weeks of (a) room air (Air; n = 7), (b) nocturnal 10% hypoxia (N10%; n = 9), and (c) continuous 10% hypoxia (C10%; n = 11) and (d) corresponding mean ± s.e.m. area under the glucose curve. Statistical differences marked by horizontal lines determined by two-tailed paired t-test.
Figure 5
Figure 5
Mitochondrial state 3 (S3), state 4 (S4), and respiratory control ratio (RCR: S3/S4) oxygen consumption and mitochondrial hydrogen peroxide production (reactive oxygen species; ROS) in lean and obese mice. (a–d) Muscle data from individual lean and obese control mice exposed to room air. (e–h) Mean ± s.e.m. change in muscle S3, S4, RCR, and ROS from room air control (Air) in lean and obese mice exposed to nocturnal 10% hypoxia (N10%) and continuous 10% hypoxia (C10%). (i–l) Liver data from individual lean and obese control mice exposed to room air. (m–p) Mean ± s.e.m. change in liver S3, S4, RCR, and ROS from room air control (Air) in lean (n = 7–11 per experimental group) and obese mice (n = 7–11 per experimental group) exposed to nocturnal 10% hypoxia (N10%) and continuous 10% hypoxia (C10%). Statistical differences marked by horizontal lines determined by two-tailed unpaired t-test. Tukey's post hoc analysis of one-way ANOVA used to determine differences relative between Air and either N10% or C10% exposure separately in lean and obese mice. p < 0.05 compared to Air, ∗∗p < 0.01 compared to Air.
Figure 6
Figure 6
Glucose transporter (GLUT1–4) expression by Western blot after two-week exposure to room air (Hypoxia), nocturnal 10% hypoxia (N10%), and continuous 10% hypoxia (C10%) in lean and obese mice.
Figure 7
Figure 7
Phosphofructokinase (PFK) activity from the muscle (a) and liver (b) in lean (white; n = 4 per experimental group) and obese (black; (n = 4 per experimental group) mice after two-week exposure to room air (Air), nocturnal 10% hypoxia (N10%), and continuous 10% hypoxia (C10%). Data shown as mean ± s.e.m. and Tukey's post hoc analysis of one-way ANOVA used to determine differences relative to Air (∗∗p < 0.01) or N10% (¥¥p < 0.01) exposure separately in lean and obese mice.

Similar articles

Cited by

References

    1. Levett D. Z., Radford E. J., Menassa D. A., et al. Acclimatization of skeletal muscle mitochondria to high-altitude hypoxia during an ascent of Everest. The FASEB Journal. 2012;26(4):1431–1441. doi: 10.1096/fj.11-197772. - DOI - PubMed
    1. Fan J. L., Subudhi A. W., Evero O., et al. AltitudeOmics: enhanced cerebrovascular reactivity and ventilatory response to CO2 with high-altitude acclimatization and reexposure. Journal of Applied Physiology. 2014;116(7):911–918. doi: 10.1152/japplphysiol.00704.2013. - DOI - PubMed
    1. Reinke C., Bevans-Fonti S., Drager L. F., Shin M. K., Polotsky V. Y. Effects of different acute hypoxic regimens on tissue oxygen profiles and metabolic outcomes. Journal of Applied Physiology. 2011;111(3):881–890. doi: 10.1152/japplphysiol.00492.2011. - DOI - PMC - PubMed
    1. Murry C. E., Jennings R. B., Reimer K. A. Preconditioning with ischemia: a delay of lethal cell injury in ischemic myocardium. Circulation. 1986;74(5):1124–1136. doi: 10.1161/01.CIR.74.5.1124. - DOI - PubMed
    1. Schott R. J., Rohmann S., Braun E. R., Schaper W. Ischemic preconditioning reduces infarct size in swine myocardium. Circulation Research. 1990;66(4):1133–1142. doi: 10.1161/01.RES.66.4.1133. - DOI - PubMed

LinkOut - more resources