

LRP1 expression in colon cancer predicts clinical outcome
- PMID: 29507659
- PMCID: PMC5823651
- DOI: 10.18632/oncotarget.24225
LRP1 expression in colon cancer predicts clinical outcome
Abstract
LRP1 (low-density lipoprotein receptor-related protein 1), a multifunctional endocytic receptor, has recently been identified as a hub within a biomarker network for multi-cancer clinical outcome prediction. As its role in colon cancer has not yet been characterized, we here investigate the relationship between LRP1 and outcome.
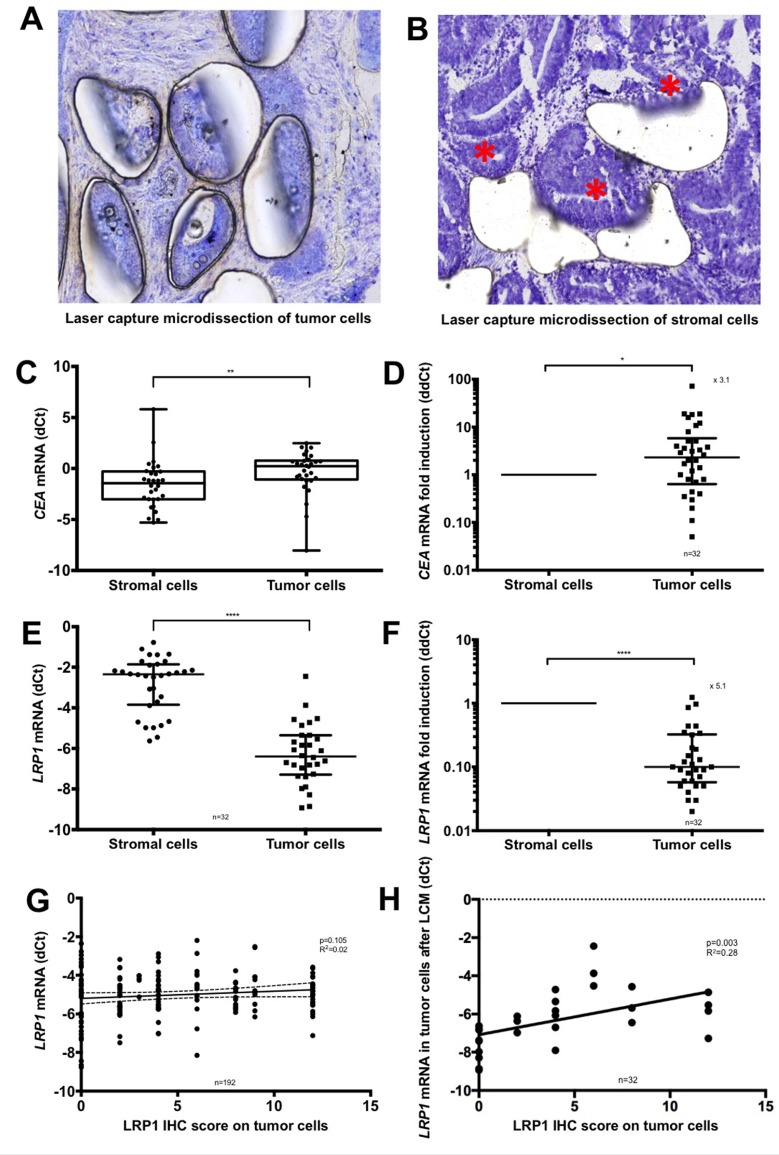
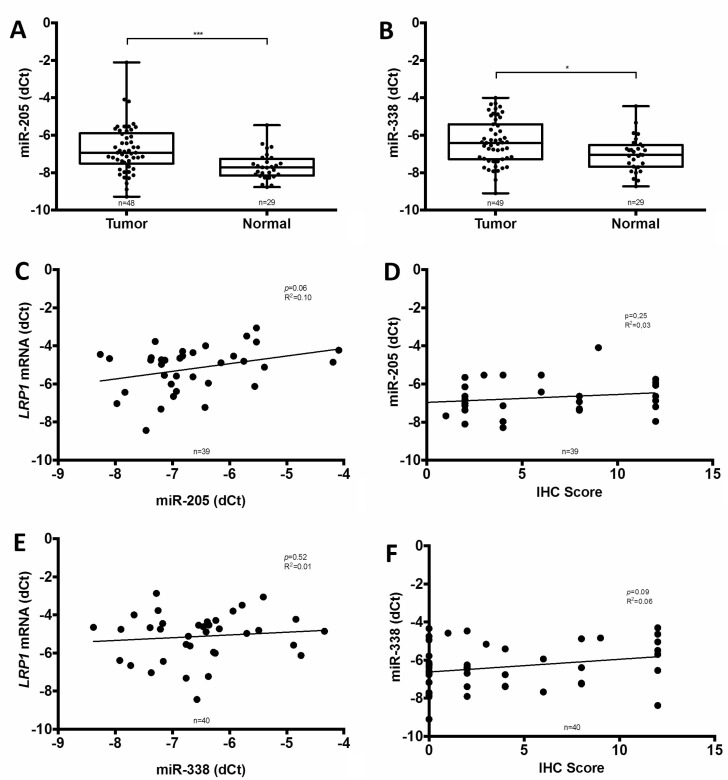
Materials and methods: LRP1 mRNA expression was determined in colon adenocarcinoma and paired colon mucosa samples, as well as in stromal and tumor cells obtained after laser capture microdissection. Clinical potential was further investigated by immunohistochemistry in a population-based colon cancer series (n = 307). LRP1 methylation, mutation and miR-205 expression were evaluated and compared with LRP1 expression levels.
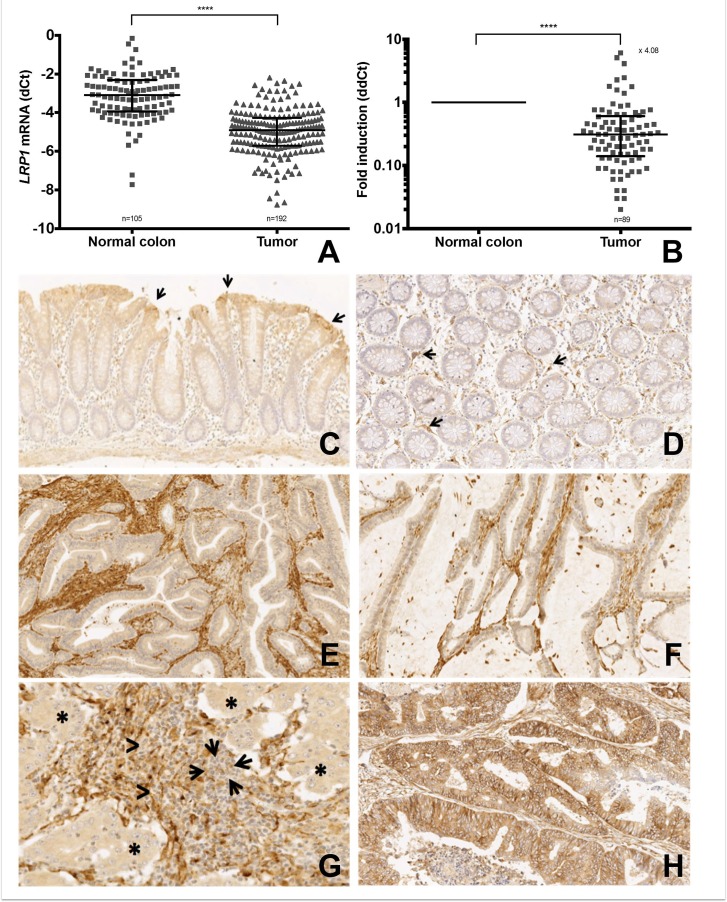
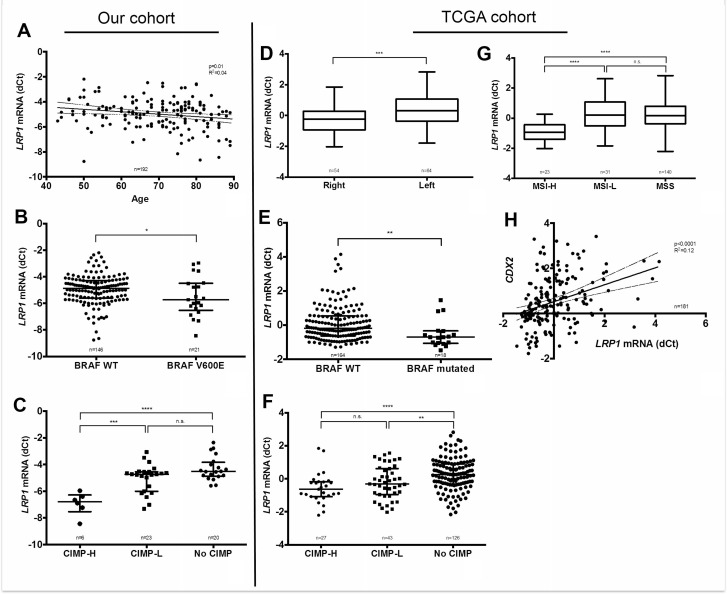
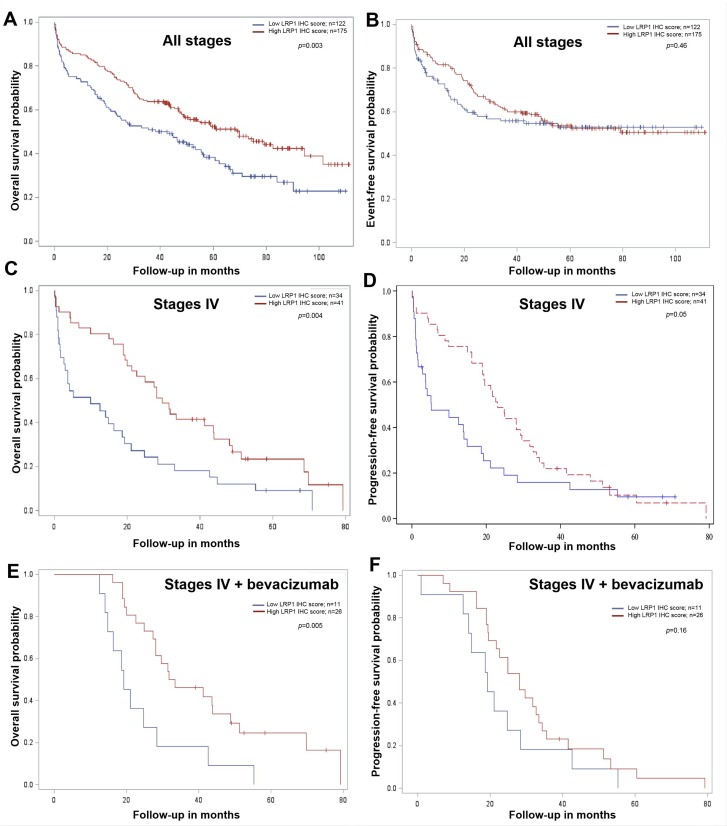
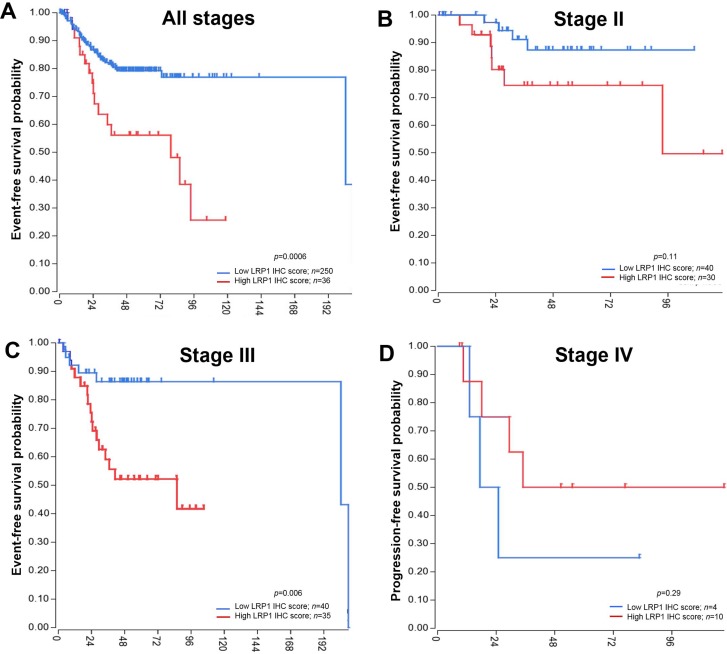
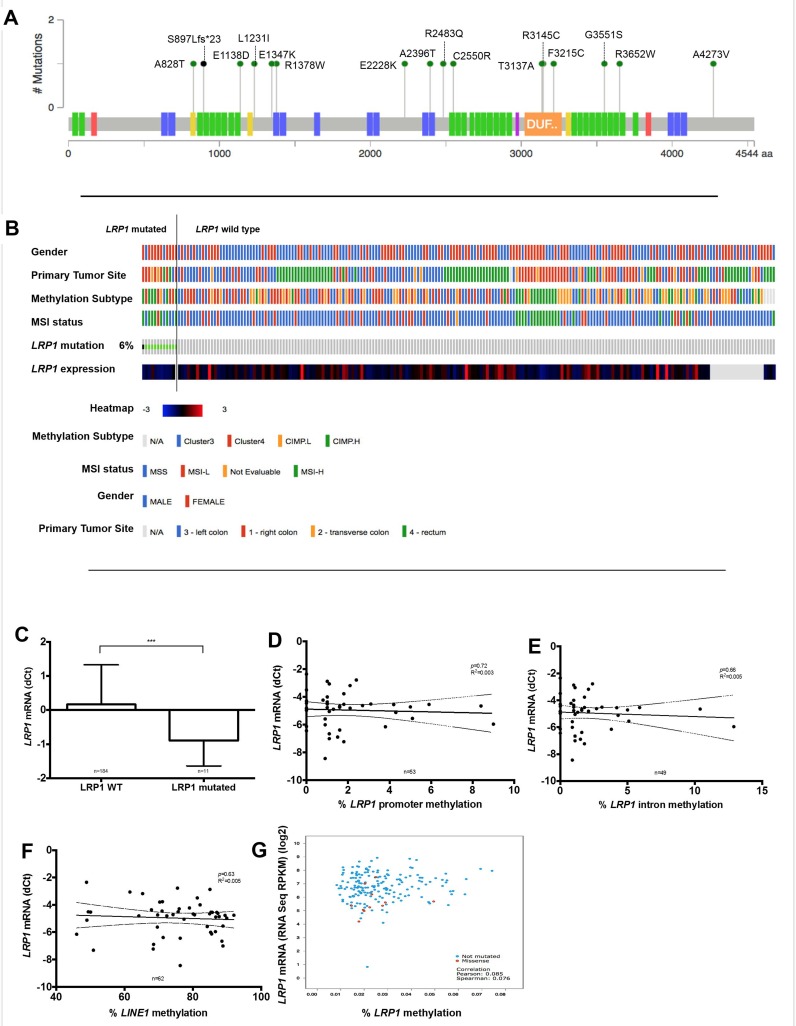
Results: LRP1 mRNA levels were significantly lower in colon adenocarcinoma cells compared with colon mucosa and stromal cells obtained after laser capture microdissection. Low LRP1 immunohistochemical expression in adenocarcinomas was associated with higher age, right-sided tumor, loss of CDX2 expression, Annexin A10 expression, CIMP-H, MSI-H and BRAFV600E mutation. Low LRP1 expression correlated with poor clinical outcome, especially in stage IV patients. While LRP1 expression was downregulated by LRP1 mutation, LRP1 promoter was never methylated.
Conclusions: Loss of LRP1 expression is associated with worse colon cancer outcomes. Mechanistically, LRP1 mutation modulates LRP1 expression.
Keywords: BRAF; LRP1; Pathology; colorectal cancer; miR-205; microsatellite instability.
Conflict of interest statement
CONFLICTS OF INTEREST The authors declare that they have no further financial or other conflicts of interest in relation to this research and its publication.
Figures
Similar articles
-
Stromal LRP1 in lung adenocarcinoma predicts clinical outcome.Clin Cancer Res. 2011 Apr 15;17(8):2426-33. doi: 10.1158/1078-0432.CCR-10-2385. Epub 2011 Feb 15. Clin Cancer Res. 2011. PMID: 21325077 Free PMC article.
-
Possible role of Cdx2 in the serrated pathway of colorectal cancer characterized by BRAF mutation, high-level CpG Island methylator phenotype and mismatch repair-deficiency.Int J Cancer. 2014 May 15;134(10):2342-51. doi: 10.1002/ijc.28564. Epub 2013 Nov 13. Int J Cancer. 2014. PMID: 24166180
-
Loss of CDX2/CK20 expression is associated with poorly differentiated carcinoma, the CpG island methylator phenotype, and adverse prognosis in microsatellite-unstable colorectal cancer.Am J Surg Pathol. 2013 Oct;37(10):1532-41. doi: 10.1097/PAS.0b013e31829ab1c1. Am J Surg Pathol. 2013. PMID: 24025523
-
Comprehensive clinicopathologic, molecular, and immunologic characterization of colorectal carcinomas with loss of three intestinal markers, CDX2, SATB2, and KRT20.Virchows Arch. 2022 Mar;480(3):543-555. doi: 10.1007/s00428-021-03260-w. Epub 2022 Jan 14. Virchows Arch. 2022. PMID: 35029777
-
Molecular and prognostic heterogeneity of microsatellite-unstable colorectal cancer.World J Gastroenterol. 2014 Apr 21;20(15):4230-43. doi: 10.3748/wjg.v20.i15.4230. World J Gastroenterol. 2014. PMID: 24764661 Free PMC article. Review.
Cited by
-
IGFBP-3 and TGF-β inhibit growth in epithelial cells by stimulating type V TGF-β receptor (TβR-V)-mediated tumor suppressor signaling.FASEB Bioadv. 2021 Jun 16;3(9):709-729. doi: 10.1096/fba.2021-00016. eCollection 2021 Sep. FASEB Bioadv. 2021. PMID: 34485840 Free PMC article.
-
Epithelial-Mesenchymal Transition-Related MicroRNAs and Their Target Genes in Colorectal Cancerogenesis.J Clin Med. 2019 Oct 3;8(10):1603. doi: 10.3390/jcm8101603. J Clin Med. 2019. PMID: 31623346 Free PMC article.
-
Proteomic Profiling of Retinoblastoma-Derived Exosomes Reveals Potential Biomarkers of Vitreous Seeding.Cancers (Basel). 2020 Jun 12;12(6):1555. doi: 10.3390/cancers12061555. Cancers (Basel). 2020. PMID: 32545553 Free PMC article.
-
The Dual Role of Low-Density Lipoprotein Receptor-Related Protein 1 in Atherosclerosis.Front Cardiovasc Med. 2021 May 28;8:682389. doi: 10.3389/fcvm.2021.682389. eCollection 2021. Front Cardiovasc Med. 2021. PMID: 34124208 Free PMC article. Review.
-
FUT2 inhibits the EMT and metastasis of colorectal cancer by increasing LRP1 fucosylation.Cell Commun Signal. 2023 Mar 27;21(1):63. doi: 10.1186/s12964-023-01060-0. Cell Commun Signal. 2023. PMID: 36973740 Free PMC article.
References
-
- Hamilton SR, Bosman FT, Boffetta P, Ilyas M, Morreau H, Nakamura SI, Quirke P, Riboli E, Sobin LH. WHO classification of tumours of the digestive system. Lyon, France: IARC Press; 2010. Carcinoma of the colon and rectum; pp. 132–46.
-
- Stewart BW, Wild CP. World cancer report 2014. Lyon, France: International Agency for Research on Cancer, World Health Organization; 2014.
-
- Sobin L, Gospodarowicz M, Wittekind C, Colon and Rectum . TNM Classification of Malignant Tumours. 7. Chicheter (West Sussex): Blackwell Publishing Ltd; 2010. pp. 100–105.
LinkOut - more resources
Full Text Sources
Other Literature Sources
Research Materials
Miscellaneous
