. 2018 Jan 3;9(10):9100-9113.
doi: 10.18632/oncotarget.23888. eCollection 2018 Feb 6.

New localization and function of calpain-2 in nucleoli of colorectal cancer cells in ribosomal biogenesis: effect of KRAS status

Affiliations

New localization and function of calpain-2 in nucleoli of colorectal cancer cells in ribosomal biogenesis: effect of KRAS status

Marcelino Telechea-Fernández et al. Oncotarget. .

Erratum in

Abstract

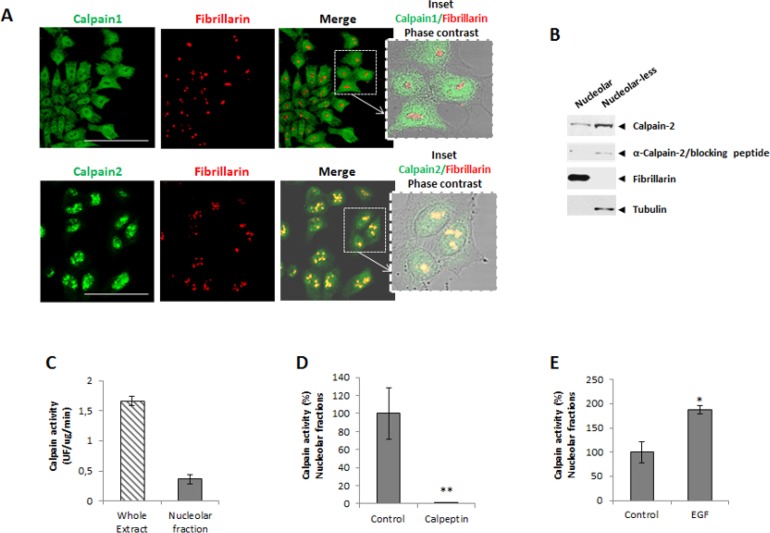
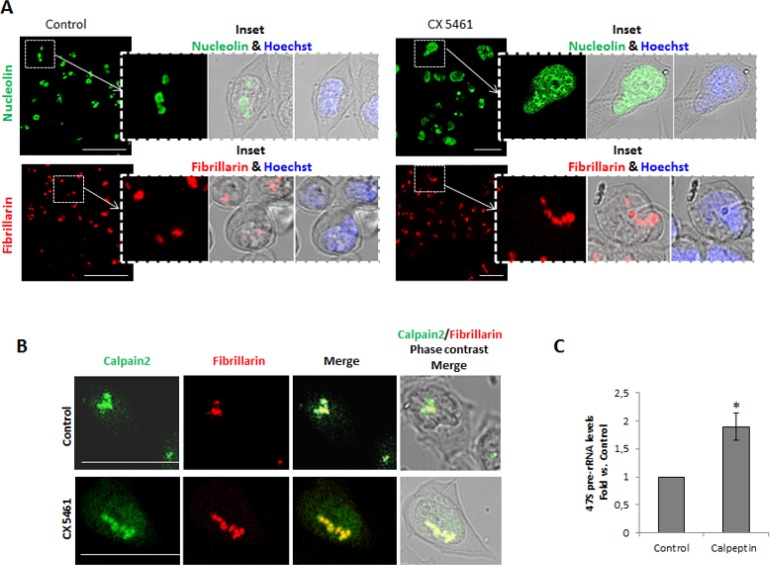
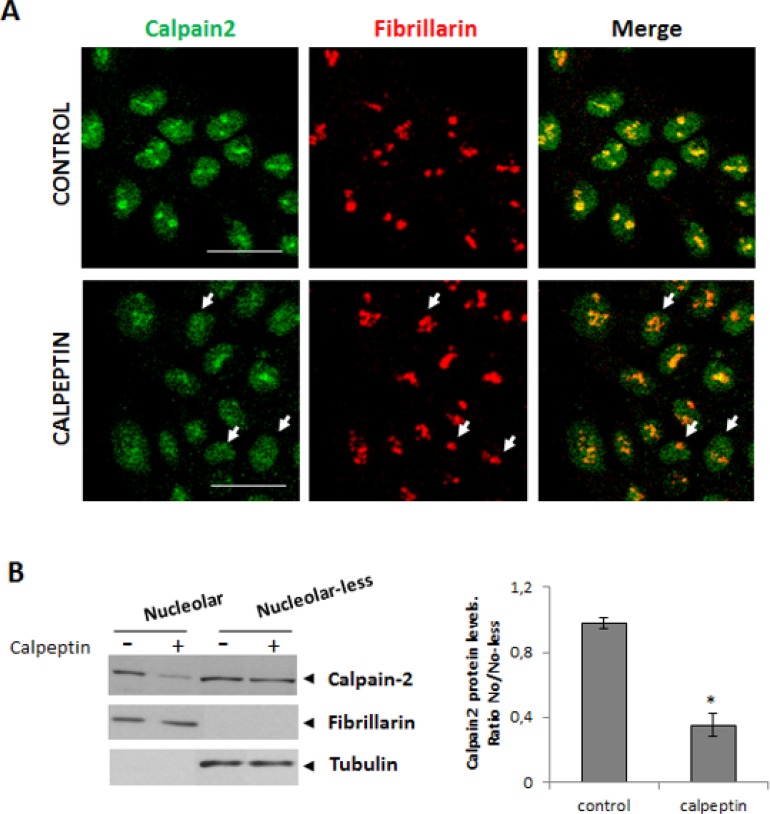
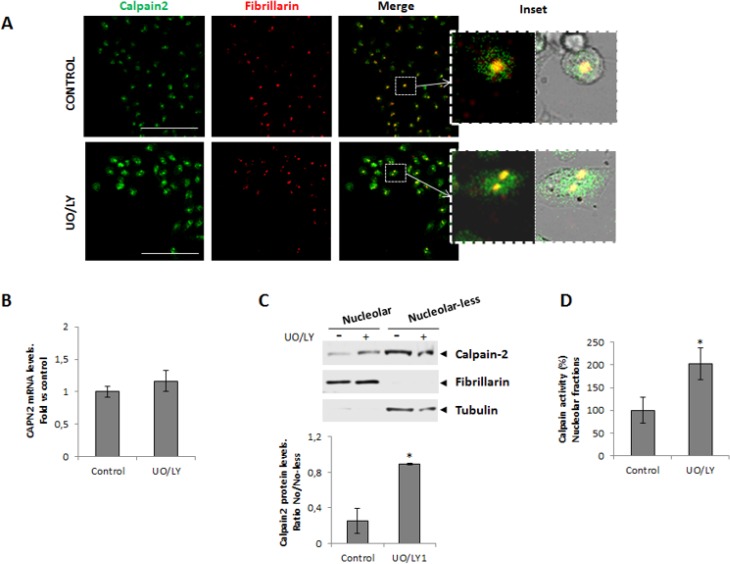
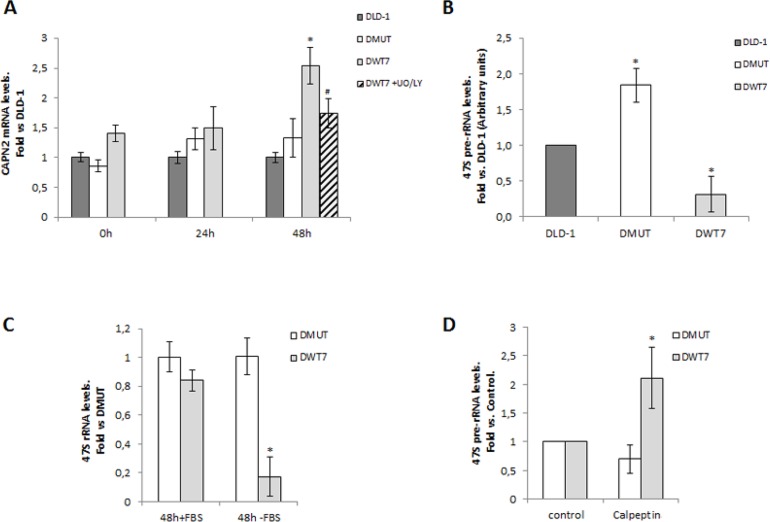
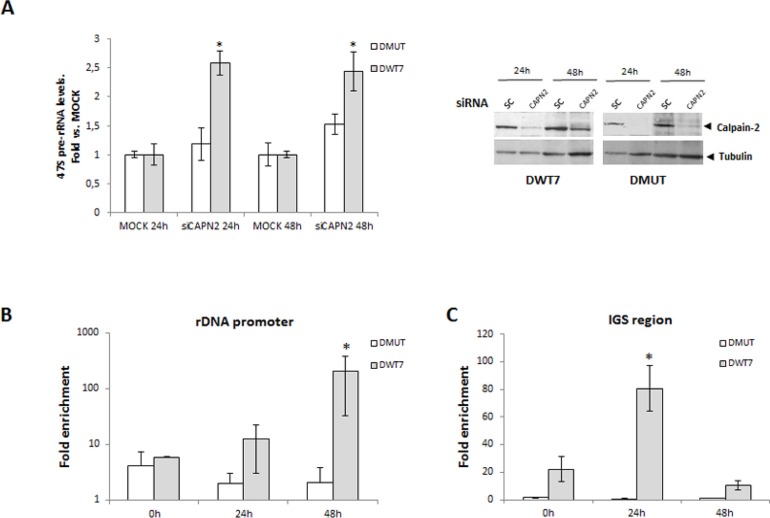
Calpain-2 belongs to a family of pleiotropic Cys-proteases with modulatory rather than degradative functions. Calpain (CAPN) overexpression has been controversially correlated with poor prognosis in several cancer types, including colorectal carcinoma (CRC). However, the mechanisms of substrate-recognition, calpain-2 regulation/deregulation and specific functions in CRC remain elusive. Herein, calpain subcellular distribution was studied as a key event for substrate-recognition and consequently, for calpain-mediated function. We describe a new localization for calpain-2 in the nucleoli of CRC cells. Calpain-2 nucleolar distribution resulted dependent on its enzymatic activity and on the mutational status of KRAS. In KRASWT/- cells serum-starvation induced CAPN2 expression, nucleolar accumulation and increased binding to the rDNA-core promoter and intergenic spacer (IGS), concomitant with a reduction in pre-rRNA levels. Depletion of calpain-2 by specific siRNA prevented pre-rRNA down-regulation after serum removal. Conversely, ribosomal biogenesis proceeded in the absence of serum in unresponsive KRASG13D/- cells whose CAPN2 expression, nucleolar localization and rDNA-occupancy remained unchanged during the time-course of serum starvation. We propose here that nucleolar calpain-2 might be a KRAS-dependent sensor to repress ribosomal biogenesis in growth limiting conditions. Under constitutive activation of the pathway commonly found in CRC, calpain-2 is deregulated and tumor cells become insensitive to the extracellular microenvironment.

Keywords: colorectal cancer; nucleolar calpain-2; pre-rRNA; serum starvation; subcellular localization.


Conflict of interest statement

CONFLICTS OF INTEREST The authors declare no conflicts of interest.

Figures

Figure 1
Figure 1. Subcellular localization of classical calpains in colorectal cancer DLD-1 cells
(A) Immunofluorescence staining of calpain-1 and calpain-2 (green), fibrillarin (red) and merge in 24 h serum-starved cells. Inset shows merge images of immunofluorescent staining and phase contrast. Scale bars 75 μm. (B) Calpain-2 in nucleolar and nucleolar-less fractions analyzed by western blot. The specificity of the band recognized by the antibody was confirmed by the use of a blocking peptide with the same anti-calpain-2 antibody. Fibrillarin (nucleolar) and tubulin (nucleolar-less) were used as markers to assess the purity of subcellular fractions. (C) Calpain activity in whole cell extracts and nucleolar fractions. (D-E) Calpain activity in protein extracts from control or after 5 min treatment with calpeptin (D) or EGF (E). Values are shown as means ± SEM expressed as percentage of calpain activity vs. Control cells. *p ≤ 0.05 and **p ≤ 0.001.
Figure 2
Figure 2. Calpain-2 relationship with rRNA biogenesis in DLD-1 cells
(A) Nucleoli disassembly in control (left) and CX5461-treated (right) cells. The effectiveness of nucleoli disruption was assessed by immunofluorescent staining with anti-nucleolin antibody (green) and anti-fibrillarin (red). Scale bars 75 μm. Insets show zoom of merge images of nucleolin or fibrillarin with phase contrast. Merge of nuclear staining with Hoechst 33342 (blue) and phase contrast is also shown. (B) Association of calpain-2 with the nucleolar subcomponent fibrillarin during nucleoli disassembly. Immunofluorescence staining of calpain-2 (green), fibrillarin (red) and merge in control and CX-5461-treated cells. Merge images of immunofluorescent staining and phase contrast are shown. Scale bars 25 μm. (C) 47S pre-rRNA levels in control or calpeptin-treated cells measured by qPCR. DLD-1 cells were serum-starved for 24 h and further cultured for 24 h in the presence of vehicle (control) or calpeptin. RT-qPCR data are plotted as fold vs. control cells. Data (n ≥ 3) are mean ± SEM. *p ≤ 0.05.
Figure 3
Figure 3. Localization of nucleolar calpain-2 after calpain activity inhibition
DLD-1 cells were serum-starved for 24 h and further cultured for 24 h in the presence of vehicle (control) or calpeptin. (A) Immunofluorescent staining of calpain-2 (green), fibrillarin (red) and merge in control and calpeptin-treated DLD-1 cells. Scale bars 25 μm. Arrows point out to representative cells with low nucleolar calpain-2 and high fibrillarin staining in calpeptin-treated cells. Yellow and orange staining indicate a high and a poor co-localization of both proteins, respectively. (B) Western blot analysis of calpain-2 in nucleolar and nucleolar-less fractions from control and calpeptin-treated cells. Fibrillarin and α- tubuline were analyzed as markers of fraction purity. Proteins were quantified and normalized by their respective fraction markers. The ratio of nucleolar/nucleolar-less calpain-2 is represented as mean ± SEM. *p ≤ 0.05 vs. control cells.
Figure 4
Figure 4. Role of MAPK/PI3K signaling pathway in the nucleolar localization of calpain-2
DLD-1 cells were serum-starved for 24 h and further cultured for 24 h in the presence of vehicle (control) or MEK and PI3K inhibitors (UO/LY). (A) Immunofluorescent staining of calpain-2 (green), fibrillarin (red) and merge in control and UO/LY-treated cells. Scale bars 75 μm. Insets show zoom of merge images of fluorescence staining and phase contrast. (B) CAPN2 mRNA levels in control or UO/LY-treated cells analyzed by RT-qPCR. Data (n ≥ 3) are plotted as mean fold ± SEM vs. control cells. (C) Western blot of calpain-2 in nucleolar and nucleolar-less fractions from control and UO/LY-treated cells. Fibrillarin and tubulin were analyzed as markers of fraction purity. Proteins were quantified and normalized by their respective fraction markers. The ratio of nucleolar/nucleolar-less calpain-2 is represented as mean ± SEM. *p ≤ 0.05 vs. control cells. (D) Calpain activity in nucleolar fractions from control or UO/LY-treated cells. Values (n ≥ 3) are mean ± SEM expressed as percentage of calpain activity vs. control cells. *p ≤ 0.05.
Figure 5
Figure 5. Effect of KRAS-mutational status on calpain-2 localization and expression in CRC cells
(A) Immunofluorescent staining of calpain-2 (green) and fibrillarin (red) in two isogenic cell lines with different KRAS-mutational status, DMUT and DWT7. Merge images are shown. Scale bars 25 μm. Arrows point to a representative cell with no detectable nucleolar calpain-2 in DMUT cells. (B) CAPN2 mRNA levels in DMUT and DWT7 cells were analyzed by RT-qPCR. (C) Total calpain-2 and calpain-1 protein levels in whole cell extracts from DMUT and DWT7 analyzed by western blot. Expression data were quantified and normalized against α-tubulin. (D) Total calpain activity in whole protein extracts from DMUT and DWT7 cells. Normalized data in (B) and (C) were plotted as fold vs. DMUT cells. Data (n ≥ 6) are mean ± SEM. No significant difference was found between cell lines.
Figure 6
Figure 6. Nucleolar calpain-2 levels in CRC cell lines with different KRAS mutational status
(A) Calpain-2 analyzed in DMUT and DWT7 cells by Western blot in nucleolar and nucleolar-less fractions. Fibrillarin and tubulin were used as markers of fraction purity. Proteins were quantified and normalized by their respective fraction markers. The ratio (n ≥ 6) of nucleolar/nucleolar-less calpain-2 is represented as mean ± SEM. *p ≤ 0.05 vs. DMUT cells. (B) Calpain activity in nucleolar fractions from DMUT and DWT7 cells. Values (n ≥ 6) are mean ± SEM *p ≤ 0.05. (C) Calpain activity in nucleolar fractions from DMUT and DWT7 cells. Values (n ≥ 6) are mean ± SEM expressed as percentage of nucleolar calapin activity from total activity in the cell. *p ≤ 0.05.
Figure 7
Figure 7. Correlation between calpain-2 expression and ribosomal biogenesis in response to serum-deprivation in CRC cell lines
Cells were serum-starved for 0, 24, and 48 h. (A) CAPN2 mRNA levels were analyzed by RT-qPCR at the indicated time points in DLD-1 (dark grey bars), DMUT (white bars) and DWT7 (light grey bars). DWT7 cells were also cultured for the last 24 h in the presence of UO/LY (dashed bars). Data (n ≥ 6) are expressed as fold vs. DLD-1 cells. *p ≤ 0.05 compared with any time point in all the cell lines. #p ≤ 0.05 compared with untreated 48 h-starved DWT7 cells. (B) 47S pre-rRNA levels after 48 h of serum deprivation were analyzed by RT-qPCR in the three cell lines. Data (n ≥ 9) are expressed as fold mean ± SEM vs. DLD-1. *p ≤ 0.05 represents statistical difference compared to other cell lines. (C) 47S pre-rRNA levels were analyzed by RT-qPCR in DMUT and DWT7 cell lines cultured for 48 h in the presence (+FBS) or absence (-FBS) of serum. Data (n ≥ 3) are expressed as fold mean ± SEM. vs. DMUT (+FBS). *p ≤ 0.01 shows significant difference compared to any group. (D) DMUT and DWT7 cells were serum-starved for 24 h and further cultured for 24 h in the presence of vehicle (control) or calpeptin. 47S pre-rRNA levels were analyzed by RT-qPCR in DMUT and DWT7 cell lines. qPCR data (n ≥ 5) are fold mean ± SEM, where *p ≤ 0.05 fold vs. control.
Figure 8
Figure 8. Isoform-specific function of calpain-2 in rRNA synthesis after serum deprivation
(A) DMUT and DWT7 cells were transfected with MOCK or siRNA CAPN2 and 24 h after transfection, cells were deprived of serum for 24 h and 48 h. 47s pre-rRNA levels were analyzed by RT-qPCR in knocked-down and MOCK cells at the indicated time points after serum-deprivation. Data (n ≥ 6) are shown as mean ± SEM fold vs. MOCK at the indicated time point for each cell line. *p ≤ 0.05 vs MOCK. A representative western blot of calpain-2 in knocked-down and MOCK cells is shown. (B-C) Calpain-2 binding to rDNA core promoter (B) or to intergenic spacer (IGS) region (C) was analyzed by ChIP assay in DMUT and DWT7 samples during the time course of serum-starvation. qPCR data of calpain-2 bound to rDNA core promoter or IGS are represented as fold enrichment relative to the IgG control. The average of three independent experiments is shown (mean ± SEM), where *p ≤ 0.01 vs. any group of samples in the experiment.

Similar articles

Cited by

References

    1. Sorimachi H, Hata S, Ono Y. Impact of genetic insights into calpain biology. J Biochem. 2011;150:23–37. - PubMed
    1. Campbell RL, Davies PL. Structure-function relationships in calpains. Biochem J. 2012;447:335–51. - PubMed
    1. Ono Y, Saido TC, Sorimachi H. Calpain research for drug discovery: challenges and potential. Nat Rev Drug Discov. 2016;15:854–876. - PubMed
    1. Sorimachi H, Mamitsuka H, Ono Y. Understanding the substrate specificity of conventional calpains. Biol Chem. 2012;393:853–71. - PubMed
    1. Conacci-Sorrell M, Ngouenet C, Anderson S, Brabletz T, Eisenman RN. Stress-induced cleavage of Myc promotes cancer cell survival. Genes Dev. 2014;28:689–707. - PMC - PubMed

LinkOut - more resources