. 2018 Jan 11;9(10):9177-9198.
doi: 10.18632/oncotarget.24183. eCollection 2018 Feb 6.

Multi-chaperone function modulation and association with cytoskeletal proteins are key features of the function of AIP in the pituitary gland

Affiliations

Multi-chaperone function modulation and association with cytoskeletal proteins are key features of the function of AIP in the pituitary gland

Laura C Hernández-Ramírez et al. Oncotarget. .

Abstract

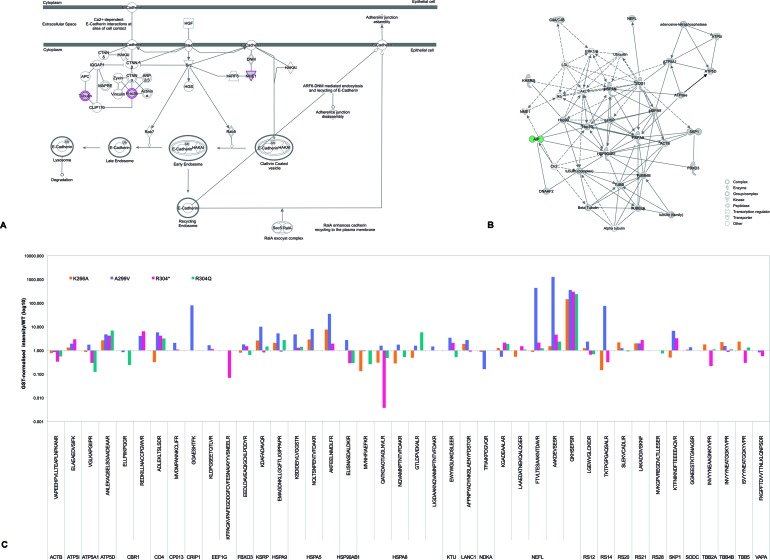
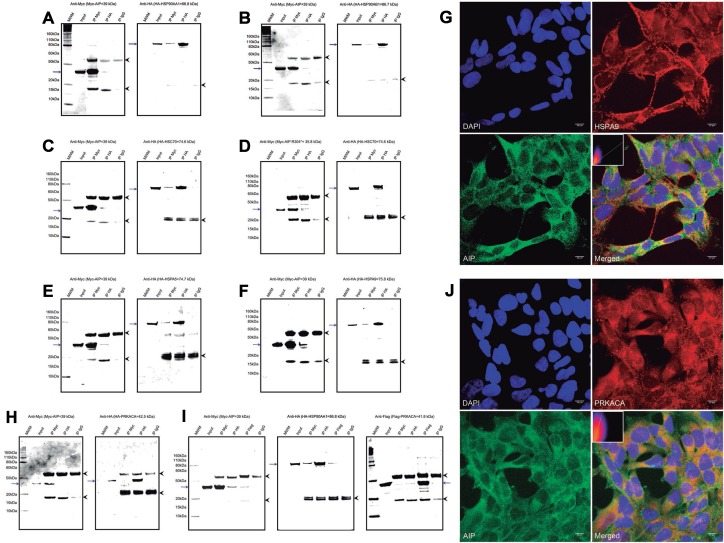
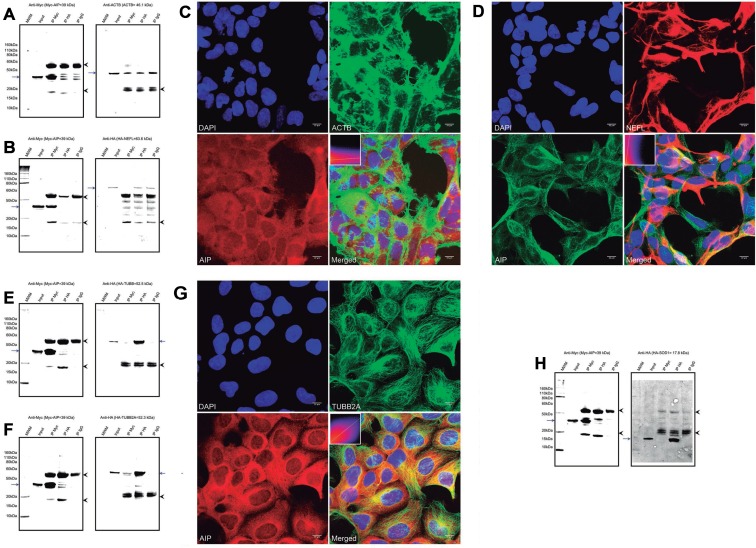
Despite the well-recognized role of loss-of-function mutations of the aryl hydrocarbon receptor interacting protein gene (AIP) predisposing to pituitary adenomas, the pituitary-specific function of this tumor suppressor remains an enigma. To determine the repertoire of interacting partners for the AIP protein in somatotroph cells, wild-type and variant AIP proteins were used for pull-down/quantitative mass spectrometry experiments against lysates of rat somatotropinoma-derived cells; relevant findings were validated by co-immunoprecipitation and co-localization. Global gene expression was studied in AIP mutation positive and negative pituitary adenomas via RNA microarrays. Direct interaction with AIP was confirmed for three known and six novel partner proteins. Novel interactions with HSPA5 and HSPA9, together with known interactions with HSP90AA1, HSP90AB1 and HSPA8, indicate that the function/stability of multiple chaperone client proteins could be perturbed by a deficient AIP co-chaperone function. Interactions with TUBB, TUBB2A, NME1 and SOD1 were also identified. The AIP variants p.R304* and p.R304Q showed impaired interactions with HSPA8, HSP90AB1, NME1 and SOD1; p.R304* also displayed reduced binding to TUBB and TUBB2A, and AIP-mutated tumors showed reduced TUBB2A expression. Our findings suggest that cytoskeletal organization, cell motility/adhesion, as well as oxidative stress responses, are functions that are likely to be involved in the tumor suppressor activity of AIP.

Keywords: AIP; FIPA; acromegaly; co-chaperone; quantitative mass spectrometry.


Conflict of interest statement

CONFLICTS OF INTEREST The authors have nothing to disclose.

Figures

Figure 1
Figure 1. AIP candidate interacting partners: signaling pathways and differential peptide repertoires in pull-down experiments
(A) The top signaling pathway reported by Ingenuity Pathway Analysis when analyzing the 30 candidate interacting partners identified for WT AIP (as listed in Table 3) was “Remodeling of the epithelial adherens junction” (P < 0.0001). This pathway included five candidate partners (ACTB, NME1, TUBB, TUBB2A, and tubulin beta-4B chain [TUBB4B]) out of the total of 68 proteins reported for such pathway by the platform used (overlap: 7.4%). Proteins in this pathway represent multiprotein complexes, with cadherins as central components, mediating cell-cell adhesion and intercellular communication, and regulating cell shape and polarity. Other top canonical pathways reported by this analysis were “Regulation of eIF4 and p70S6K signaling” (5/157 proteins [3.2%], P < 0.0001), “EIF2 signaling” (5/194 [2.6%], P < 0.0001), “mTOR signaling” (5/199 [2.5%], P < 0.0001) and “Protein ubiquitination pathway” (5/255 [2.5%], P < 0.0001). Proteins marked in pink are among the AIP candidate interacting partners identified by our pull-down experiments. F-actin refers to “filamentous actin” (i.e. a polymer of actin molecules, including ACTB among other isoforms) which forms part of the cytoskeleton. (B) Nineteen of the AIP WT candidate partners were grouped together in a single network, either due to functional relationships or direct binding. (C) Schematic representation of the pull-down data presented in Supplementary Table 2 (in a logarithmic scale for easy overview) including only proteins present in the AIP WT experiment. Proteins whose peptides were underrepresented in the AIP variant protein pull-down experiments were interpreted as impaired or lost interactions.
Figure 2
Figure 2. AIP interacts with multiple proteins from the HSP90 and HSP70 families of molecular chaperones
WT AIP interactions with HSP90AA1 (A) and HSP90AB1 (B) were confirmed by co-IP, validating the experimental procedures. Also by co-IP, HSPA8 interacted with WT AIP (C), but not with the p.R304* mutant (D), as predicted by the pull-down experiment results. Interactions with two novel molecular chaperones were validated by co-IP: HSPA5 (E) and HSPA9 (F). Co-localization of AIP and HSPA9 (G) was confirmed in the mitochondrial network, with a Pearson’s R-value of 0.72. (H) AIP does not co-immunoprecipitate with PRKACA, ruling out direct interaction of these two proteins. (I) However, in the presence of HSP90AB1, the three proteins co-immunoprecipitate with the anti-Myc, anti-HA and anti-Flag antibodies. (J) Areas of co-localization for AIP and PRKACA were detected in the cytoplasm, although with a weaker correlation compared with HSPA9, for a Pearson’s R-value of 0.39. For the co-IP experiments a-f and h, the left panels represent anti-Myc western blot (WB) membranes and the right panels, anti-HA WB membranes. For the co-IP experiment presented in i the additional panel at the extreme right presents an anti-Flag WB membrane. The blue arrows in all the panels represent the protein of interest in each WB membrane (Myc-AIP on the left panels, and HA-tagged proteins on the right panels, plus Flag-PRKACA in experiment i). The arrowheads in all the panels point out the heavy (top) and light (bottom) chains of mouse immunoglobulins. IP: immunoprecipitation, MWM: molecular weight marker. The immunocytofluorescence images (G and J) are reconstructions of representative images of the z-stacks obtained, at a 63× magnification. Top left: nuclei (DAPI), top right: HSPA9 (G) or PRKACA (J), bottom left: AIP and bottom right: merged image. Inserts in the merged images present 2-D intensity histograms corresponding to the co-localization calculations.
Figure 3
Figure 3. Interactions of AIP with cytoskeletal proteins, the cytoskeletal organizer and tumor suppressor NME1, and the enzyme SOD1
(A) A co-IP experiment for AIP and ACTB showed inconclusive results, as the protein was precipitated by the IgG negative control. (B) Co-IP for AIP and NEFL rendered negative results. (C) ACTB and AIP displayed different distribution patterns in the cell and co-localized only in small perinuclear areas, for a Pearson’s R-value of 0.17. (D) Likewise, only small areas of co-localization in a few cells were identified for AIP and NEFL, for a Pearson’s R-value of 0.38. Positive co-IP experiments were obtained for TUBB (E) and TUBB2A (F), although the band representing HA-TUBB when immunoprecipitating with an anti-Myc antibody was weak. (G) AIP and TUBB2A clearly co-localize in the cytoplasm, particularly in the perinuclear area (Pearson’s R-value of 0.54). (H) Positive co-IP of AIP and NME1 was observed, although only when the proteins were detected using the anti-Myc antibody. (I) Likewise, co-IP of AIP and SOD1 was observed only when detection was performed using the anti-Myc antibody, but not when using the anti-HA antibody. For the co-IP experiments a, b, e, f and h, the left panels represent anti-Myc WB membranes and the right panels, anti-HA WB membranes. The blue arrows in all the panels represent the protein of interest in each WB membrane (Myc-AIP on the left panels, and HA-tagged proteins on the right panels). The arrowheads in all the panels point out the heavy (top) and light (bottom) chains of mouse immunoglobulins. IP: immunoprecipitation, MWM: molecular weight marker. The immunocytofluorescence images (c, d and g) are reconstructions of representative images of the z-stacks obtained, at a 63× magnification. Top left: nuclei (DAPI), top right: ACTB (c), NEFL (d), or TUBB2A (g); bottom left: AIP and bottom right: merged image. Inserts in the merged images present 2-D intensity histograms corresponding to the co-localization calculations.

Similar articles

Cited by

References

    1. Chahal HS, Trivellin G, Leontiou CA, Alband N, Fowkes RC, Tahir A, Igreja SC, Chapple JP, Jordan S, Lupp A, Schulz S, Ansorge O, Karavitaki N, et al. Somatostatin analogs modulate AIP in somatotroph adenomas: the role of the ZAC1 pathway. J Clin Endocrinol Metab. 2012;97:E1411–20. https://doi.org/10.1210/jc.2012-1111. - DOI - PubMed
    1. Formosa R, Xuereb-Anastasi A, Vassallo J. Aip regulates cAMP signalling and GH secretion in GH3 cells. Endocr Relat Cancer. 2013;20:495–505. https://doi.org/10.1530/ERC-13-0043. - DOI - PubMed
    1. Tuominen I, Heliovaara E, Raitila A, Rautiainen MR, Mehine M, Katainen R, Donner I, Aittomaki V, Lehtonen HJ, Ahlsten M, Kivipelto L, Schalin-Jantti C, Arola J, et al. AIP inactivation leads to pituitary tumorigenesis through defective Galpha-cAMP signaling. Oncogene. 2015;34:1174–84. https://doi.org/10.1038/onc.2014.50. - DOI - PubMed
    1. Vierimaa O, Georgitsi M, Lehtonen R, Vahteristo P, Kokko A, Raitila A, Tuppurainen K, Ebeling TM, Salmela PI, Paschke R, Gundogdu S, De Menis E, Makinen MJ, et al. Pituitary adenoma predisposition caused by germline mutations in the AIP gene. Science. 2006;312:1228–30. https://doi.org/10.1126/science.1126100. - DOI - PubMed
    1. Daly AF, Tichomirowa MA, Petrossians P, Heliovaara E, Jaffrain-Rea ML, Barlier A, Naves LA, Ebeling T, Karhu A, Raappana A, Cazabat L, De Menis E, Montanana CF, et al. Clinical characteristics and therapeutic responses in patients with germ-line AIP mutations and pituitary adenomas: an international collaborative study. J Clin Endocrinol Metab. 2010;95:E373–83. https://doi.org/10.1210/jc.2009-2556. - DOI - PubMed