. 2018 Jan 20;9(10):9325-9343.
doi: 10.18632/oncotarget.24282. eCollection 2018 Feb 6.

Copper/MYC/CTR1 interplay: a dangerous relationship in hepatocellular carcinoma

Affiliations

Copper/MYC/CTR1 interplay: a dangerous relationship in hepatocellular carcinoma

Cristiana Porcu et al. Oncotarget. .

Abstract

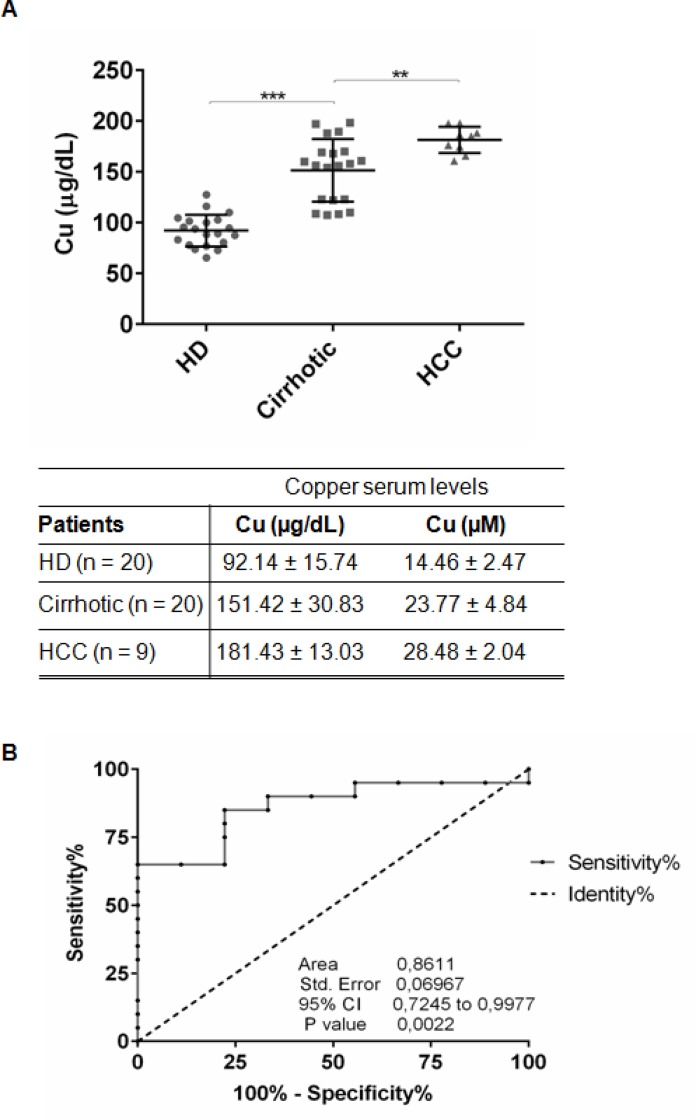
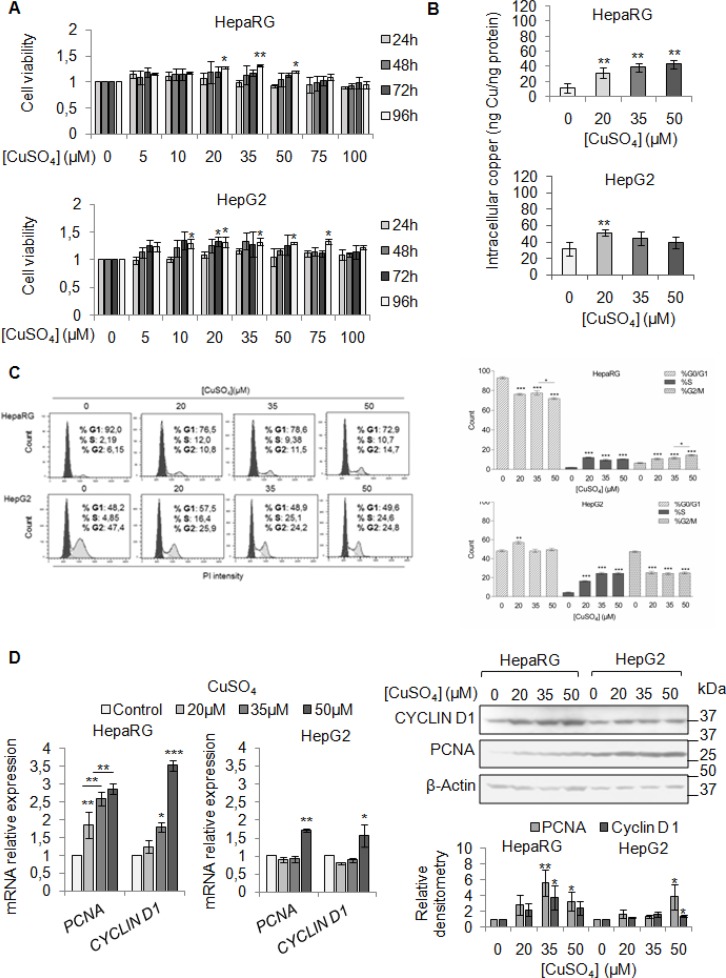
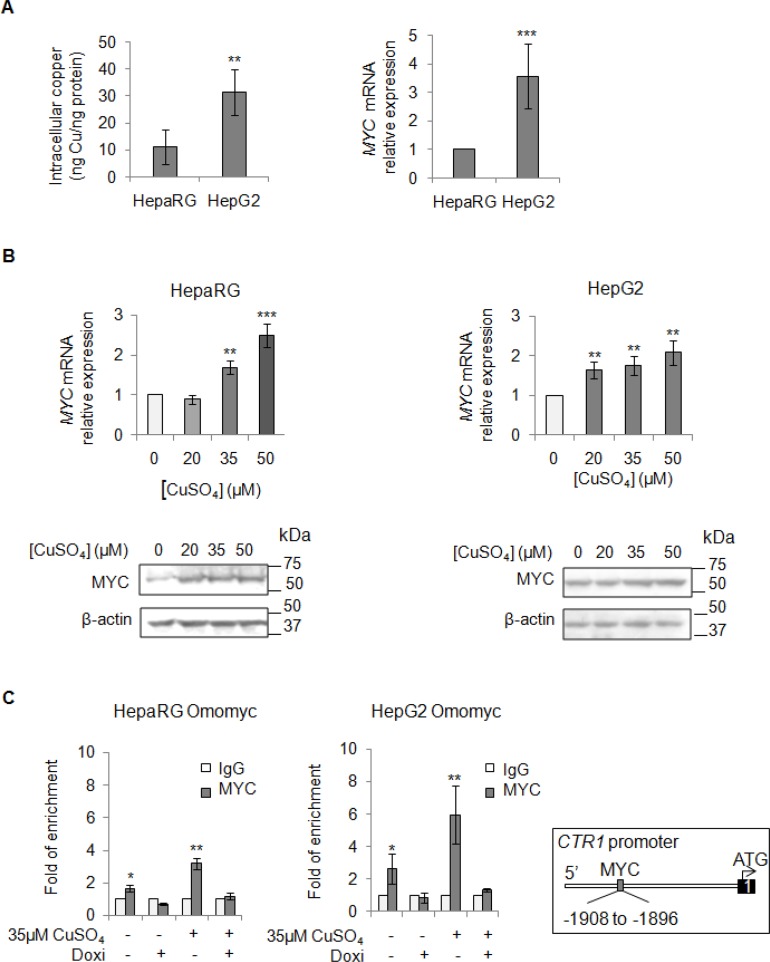
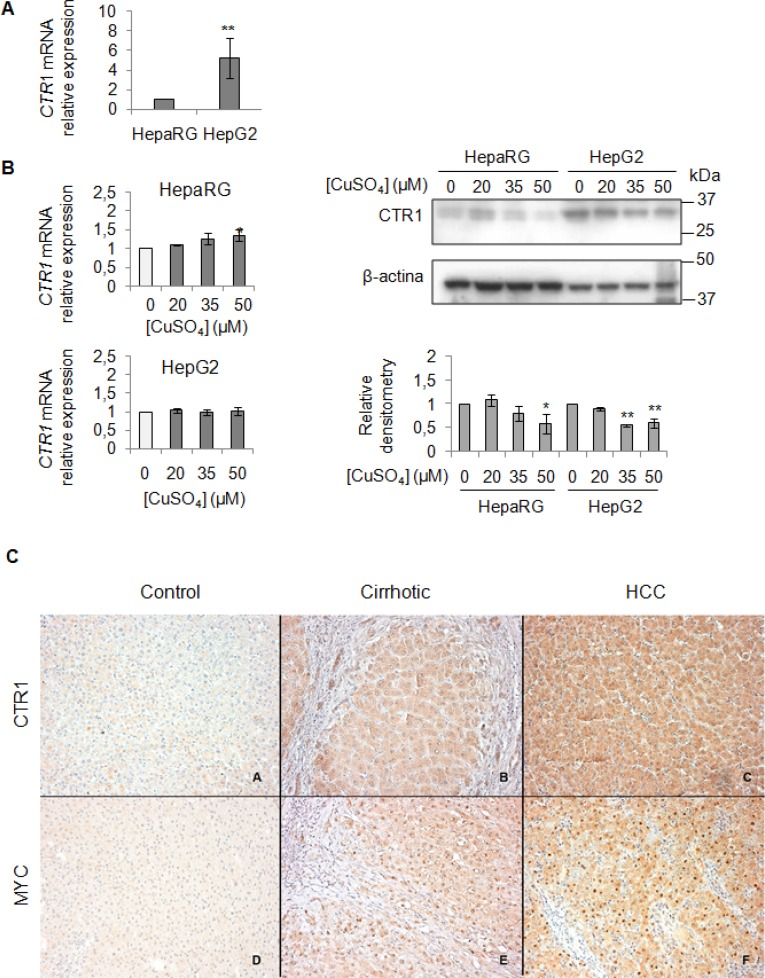
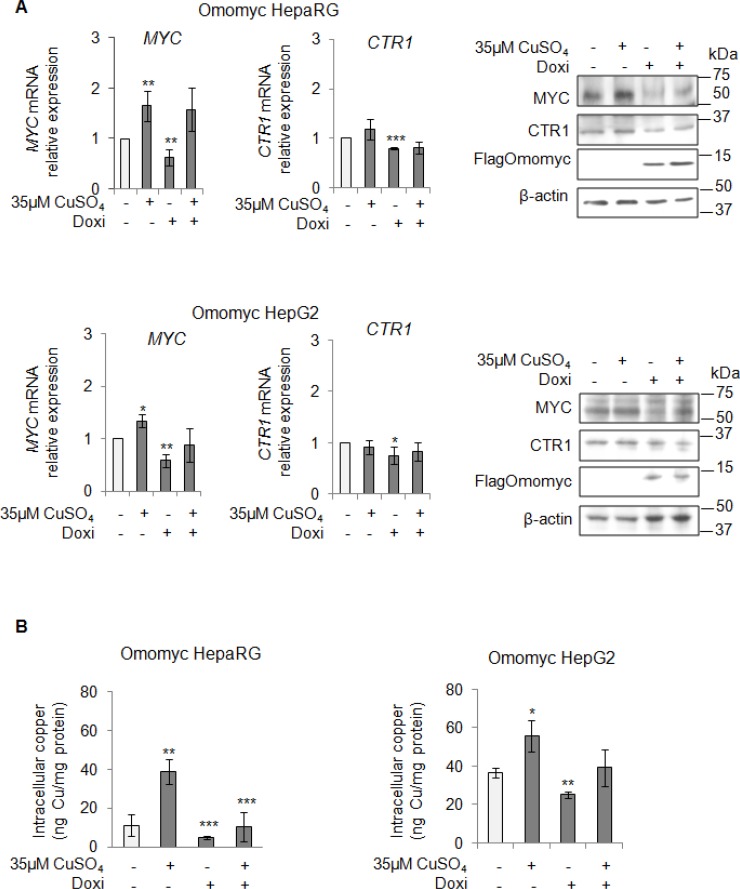
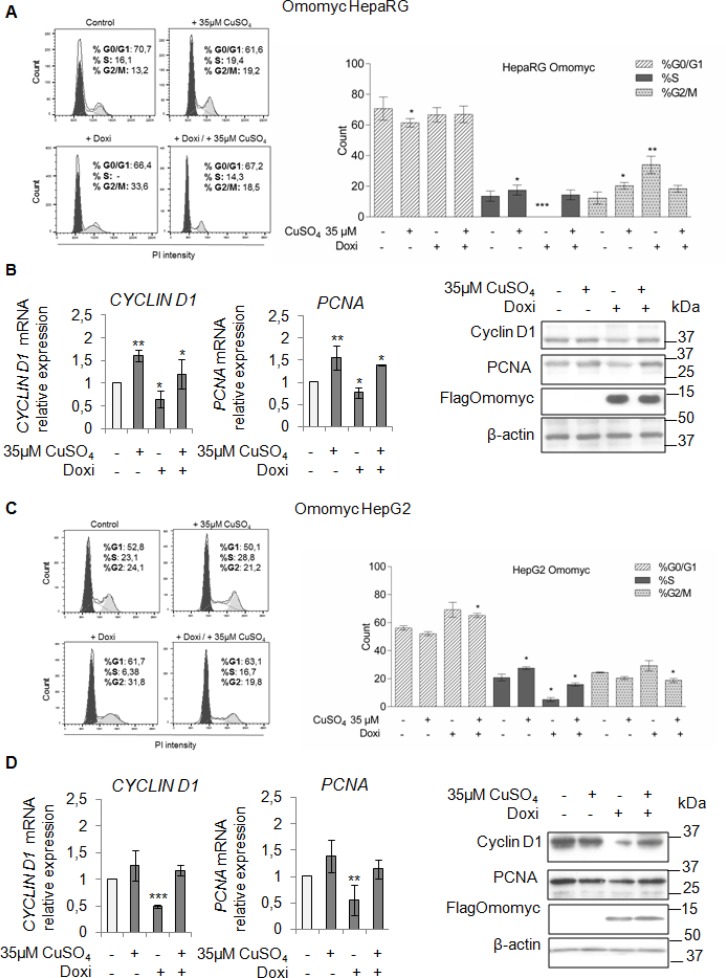
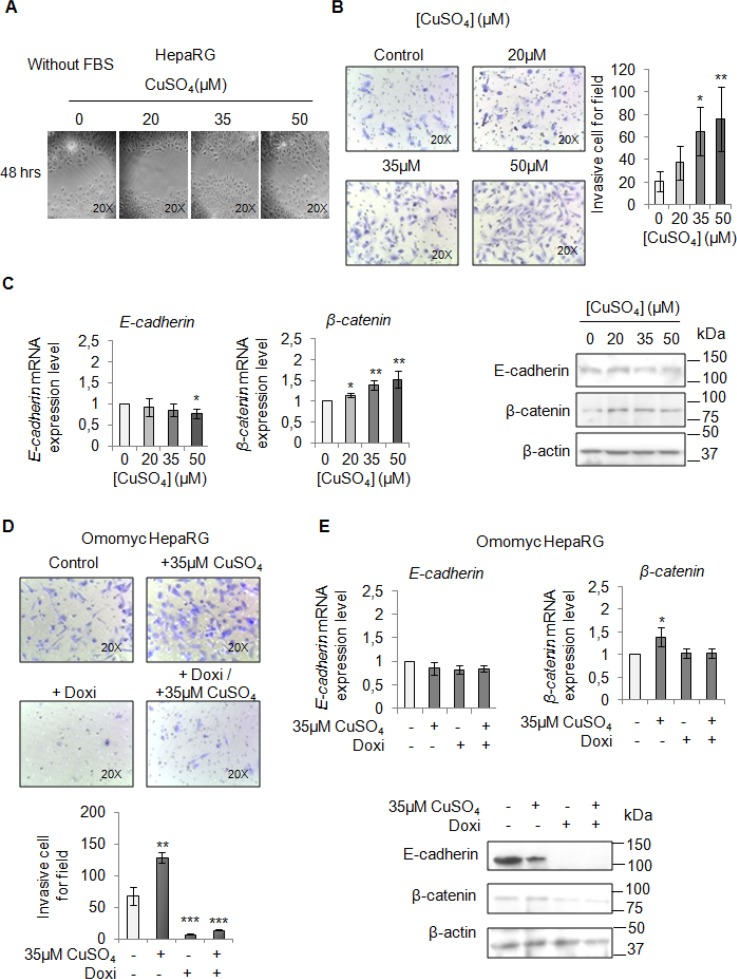
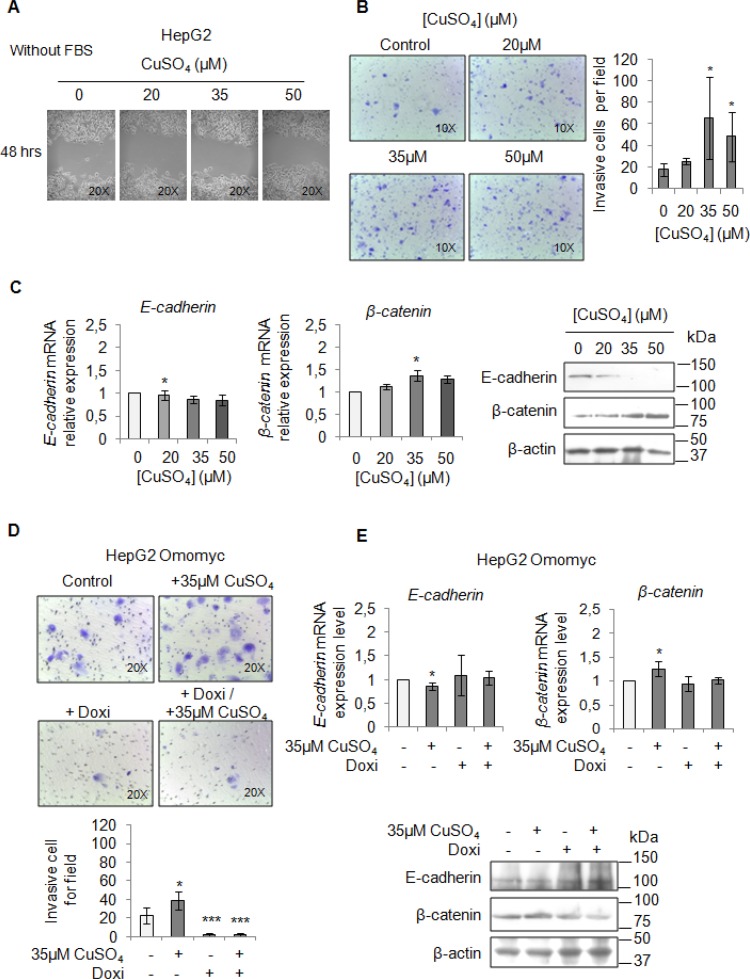
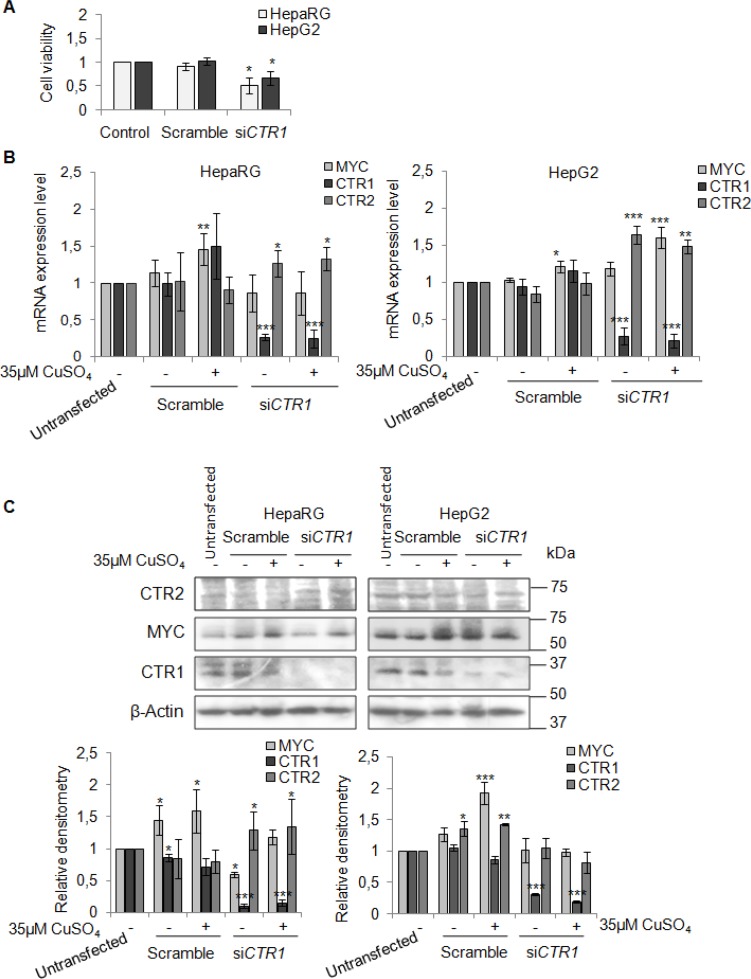
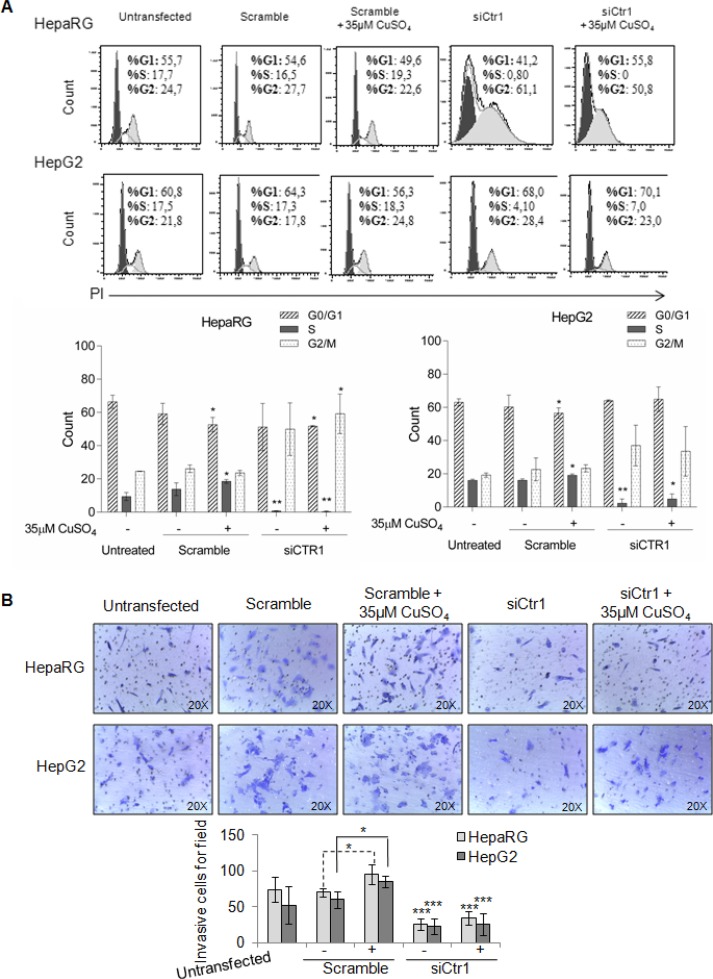
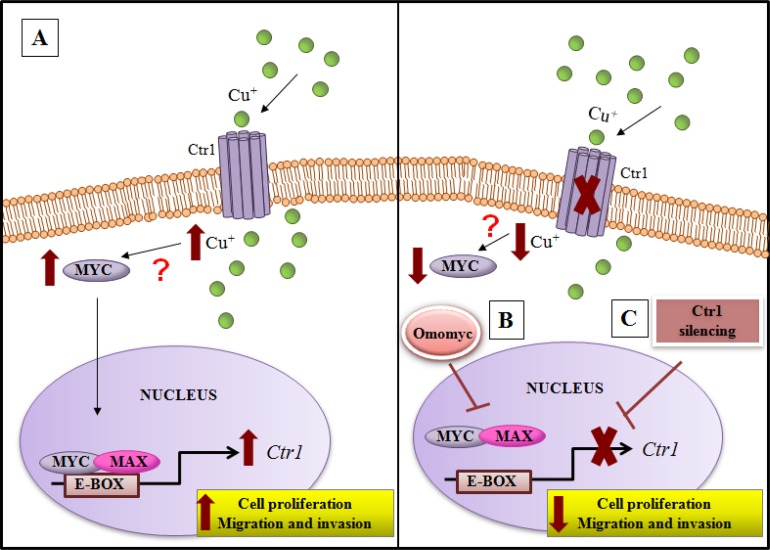
Free serum copper correlates with tumor incidence and progression of human cancers, including hepatocellular carcinoma (HCC). Copper extracellular uptake is provided by the transporter CTR1, whose expression is regulated to avoid excessive intracellular copper entry. Inadequate copper serum concentration is involved in the pathogenesis of Non Alcoholic Fatty Liver Disease (NAFLD), which is becoming a major cause of liver damage progression and HCC incidence. Finally, MYC is over-expressed in most of HCCs and is a critical regulator of cellular growth, tumor invasion and metastasis. The purpose of our study was to understand if higher serum copper concentrations might be involved in the progression of NAFLD-cirrhosis toward-HCC. We investigated whether high exogenous copper levels sensitize liver cells to transformation and if it exists an interplay between copper-related proteins and MYC oncogene. NAFLD-cirrhotic patients were characterized by a statistical significant enhancement of serum copper levels, even more evident in HCC patients. We demonstrated that high extracellular copper concentrations increase cell growth, migration, and invasion of liver cancer cells by modulating MYC/CTR1 axis. We highlighted that MYC binds a specific region of the CTR1 promoter, regulating its transcription. Accordingly, CTR1 and MYC proteins expression were progressively up-regulated in liver tissues from NAFLD-cirrhotic to HCC patients. This work provides novel insights on the molecular mechanisms by which copper may favor the progression from cirrhosis to cancer. The Cu/MYC/CTR1 interplay opens a window to refine HCC diagnosis and design new combined therapies.

Keywords: CTR1; MYC; copper; hepatocellular carcinoma; non alcoholic fatty liver disease.


Conflict of interest statement

CONFLICTS OF INTEREST The authors declare that they have no conflicts of interest.

Figures

Figure 1
Figure 1. Serum copper level in cirrhotic and HCC patients
(A) Copper level in serum of HD (n = 20), Cirrhotic (n = 20) and HCC (n = 9) patients quantified by atomic absorption spectroscopy. The results are represented as mean values ± SD. (**P < 0.01 and ***P < 0.001). (B) Sensitivity and Specificity ROC curve based on copper serum levels in HCC versus cirrhotic patients.
Figure 2
Figure 2. Copper promotes cell proliferation in liver cells
(A) Relative cell viability evaluated by MTS assay. Relative cell viability of treated cells has been evaluated respect to untreated cells, considered as 0. The results, derived from five independent experiments, are represented as mean ± SD. (B) Intracellular copper levels assayed by atomic absorption spectroscopy after 96 hrs of 20, 35 and 50 μM CuSO4 treatment. Values are expressed as mean ± SD. (*P < 0.05 and **P < 0.01; n = 5). (C) Left: Representative distribution of control and treated cells with CuSO4 (in serum free medium) in G0/G1, S and G2/M phases of cell cycle done by Propidium Iodide (PI) staining and flow cytometric analysis. Right: Histograms reported the values as mean ± SD. (*P < 0.05; **P < 0.01; ***P < 0.001; n = 3). (D) Relative mRNA expression (Left), representative western blot (Top, Right) and the relative densitomentric analysis (Bottom, Right) of PCNA and Cyclin D1 in Control and copper treated cells. Values are expressed as mean ± SD. (*P < 0.05 and **P < 0.01; n = 3).
Figure 3
Figure 3. Direct interaction between MYC and CTR1
(A) Left: Basal intracellular copper levels assayed by atomic absorption spectroscopy in HepaRg and HepG2 cells. Right: relative mRNA expression of MYC in HepG2 and HepaRG cells. Values are expressed as mean ± SD. (**P < 0.01 and ***P < 0.001; n = 5). (B) Relative mRNA expression and representative western blots of MYC in HepaRG (Left) and HepG2 (Right) cells after 20, 35 and 50 μM CuSO4 treatment (96 hrs). Values are expressed as fold mean ± SD. (**P < 0.01; n = 3). (C) MYC binding to the CTR1 promoter region, assayed by ChIP, after induction of Omomyc by doxycyclin (Doxi), before and after treatment with 35 μM CuSO4 (96 hrs). Values are expressed as fold mean ± SD of three independent experiments (*P < 0.05 and **P < 0.01). IgG was used as negative ChIP control. Right: Schematic representation of the MYC binding consensus sequences on the CTR1 promoter.
Figure 4
Figure 4
Exogenous copper modulates CTR1 and MYC protein expression (A) Relative mRNA expression of CTR1 measured by RT-PCR in HepG2 respect to HepaRG. Values are expressed as fold mean ± SD. (**P < 0.01; n = 5). (B) Left: Relative mRNA expression of CTR1 in both cells after 96 hrs of copper treatment. Right: Representative western blot of CTR1 and relative densitometry of three independent experiments. Values are expressed as fold mean ± SD. (*P < 0.05 and **P < 0.01; n = 3). (C) Immunohistochemical analysis of CTR1 and MYC protein expression. Panels A and D: two representative cases of normal liver tissue; Panels B and E: liver cirrhotic tissues. Panel C and F: hepatocellular carcinoma tissues. Avidin-Biotin-Peroxidase complex method in paraffin sections lightly counterstained with ematoxylin. Original magnification 200×
Figure 5
Figure 5. MYC modulates the intracellular copper homeostasis
(A) Relative mRNA expression (Left) and representative western blots (Right) of MYC, CTR1 and FlagOmomyc in Omomyc HepaRG (Top) and HepG2 (Bottom) cells before and after induction of Omomyc by doxycyclin (Doxi), treated or not with 35 μM CuSO4 (96 hrs). Values are expressed as fold mean ± SD. (*P < 0.05; **P < 0.01 and ***P < 0.001; n = 3). (B) Intracellular copper levels in Omomyc HepaRG (Left) and HepG2 (Right) cells in the same experimental condition described above. Values are expressed as fold mean ± SD. (*P < 0.05; **P < 0.01 and ***P < 0.001; n = 3).
Figure 6
Figure 6. Omomyc and copper-induced proliferation
(A and C) Left: Representative distribution plot of HepaRG (A) and HepG2 (C), after induction of Omomyc by doxycyclin (Doxi), before and after treatment with 35 μM CuSO4 (96 hrs), in G0/G1, S and G2/M phases of the cell cycle analysed by PI staining and flow cytometric analysis. Right: Histograms reported values as mean ± SD (*P < 0.05; **P < 0.01; ***P < 0.001; n = 3). (B and D) Relative mRNA expression (Left) and representative western blots (Right) of Cyclin D1, PCNA and FlagOmomyc in HepaRG (B) and HepG2 (D) cells in the same experimental condition described above (*P < 0.05; **P < 0.01; ***P < 0.001; n = 3).
Figure 7
Figure 7. Copper promotes HepaRG invasion by MYC
(A) Analysis of cell migration by a wound-healing assay in control and CuSO4 treated HepaRG cells. Representative microphotographs taken at 48 hrs post-wound (×20). (B) Transwell migration assay in HepaRG cells treated with copper for 48 hrs, in serum free medium. Left: Representative microphotographs of crystal violet stained cells migrated to the bottom membrane of transwell (×20). Right: Quantification of the number of migratory cells, that were counted in 5 non-overlapping random fields of the membrane. Values are expressed as fold mean ± SD. (*P < 0.05 and **P < 0.01; n = 3). (C) Relative mRNA expression (Left) and representative western blots (Right) of E-cadherin and β-catenin in HepaRG treated with CuSO4 up to 96 hrs. Values are expressed as fold mean ± SD. (*P < 0.05; n = 3). (D) Transwell migration assay in Omomyc HepaRG cells performed in a serum-supplemented medium, after induction of Omomyc by doxycyclin (Doxi), before and after treatment with 35 μM CuSO4 (48 hrs). Top: Representative microphotographs of crystal violet stained cells attached to the bottom membrane of a transwell (×20). Bottom: Quantification of the number of migratory cells using the transwell assay. Migratory cells were counted in five non-overlapping random fields of the membrane. Values are expressed as fold mean ± SD. (*P < 0.05 and ***P < 0.001; n = 3). (E) Relative mRNA expression (Top) and representative western blots (Bottom) of E-cadherin and β-catenin in Omomyc HepaRG cells treated or not with copper treatment (96 hrs). Values are expressed as fold mean ± SD (*P < 0.05; n = 3).
Figure 8
Figure 8. Copper induces HepG2 migration by MYC
(A) Analysis of cell migration by a wound-healing assay in Control and CuSO4 treated HepG2 cells. Representative microphotographs taken at 48 hrs post-wound (×20). (B) Transwell migration assay in HepG2 cells treated with copper for 48 hrs in serum free medium. Left: Representative microphotographs of crystal violet stained cells attached to the bottom membrane of a transwell (×20). Right: Quantification of the number of migratory cells, that were counted in five non-overlapping random fields of the membrane. Values are expressed as fold mean ± SD. (*P < 0.05; n = 3). (C) Relative mRNA expression (Left) and representative western blots (Right) of E-cadherin and β-catenin in HepG2 treated with CuSO4 for 96 hrs. Values are expressed as fold mean ± SD. (*P < 0.05; n = 3). (D) Transwell migration assay in HepG2 Omomyc cells in a serum-supplemented medium, after induction of Omomyc by doxycyclin (Doxi), before and after treatment with 35 μM CuSO4 (48 hrs). Top: Representative microphotographs of crystal violet stained cells attached to the bottom membrane of a transwell (×20). Bottom: Quantification of the number of migratory cells, that were counted in five non-overlapping random fields of the membrane. Values are expressed as fold mean ± SD. (*P < 0.05 and ***P < 0.001; n = 3). (E) Relative mRNA expression (Top) and representative western blots (Bottom) of E-cadherin and β-catenin in HepG2 Omomyc inducing cells in presence or not of copper treatment for 96 hrs. Values are expressed as fold mean ± SD (*P < 0.05; n = 3).
Figure 9
Figure 9. CTR1 silencing
(A) Relative cell viability evaluated by MTS assay. Results derived from three independent experiments and are represented as mean ± SD, respect to un-transfected cells. (B) Relative mRNA expression of MYC, CTR1 and CTR2 in scramble and siCTR1 transfected cells, in presence or absence of copper treatment (35 μM CuSO4). Values are expressed as mean ± SD (*P < 0.05, **P < 0.01, and ***P < 0.001, respect to un-transfected cells; n = 3). (C) Representative western blot (Top) and the relative densitomentric analysis (Bottom) of MYC, CTR1 and CTR2. Values are expressed as mean ± SD (*P < 0.05, **P < 0.01, and ***P < 0.001, respect to un-transfected cells; n = 3).
Figure 10
Figure 10. Biological effects of siCTR1
(A) Top: Representative cell cycle distribution of un-trasfected, transfected, scramble and siCTR1 cells, in presence or not of 35 μM CuSO4 treatment. Cell cycle was done by Propidium Iodide (PI) staining and flow cytometry analysis. Bottom: Histograms reported the values as mean ± SD (*P < 0.05; **P < 0.01, respect to untreated cells; n = 3). (B) Transwell migration assay of HepaRG and HepG2 cells performed after 48 hrs in un-trasfected, transfected, scramble and siCTR1 cells, with or without CuSO4 treatment. Top: Representative microphotographs of crystal violet stained cells migrated to the bottom membrane of transwell (×20). Bottom: Quantification of the number of migratory cells, counted in 5 non-overlapping random fields of the membrane. Values are expressed as fold mean ± SD. (*P < 0.05 and **P < 0.01; n = 3).
Figure 11
Figure 11. Model of copper/MYC/CTR1 axis in liver cells
(A) Higher levels of extracellular copper increase MYC expression that in turn by a direct interaction with the CTR1 promoter induces its transcription. The biological effect of MYC/CTR1 interplay promotes cell proliferation and invasiveness by the increased copper intracellular concentration. (B) Conversely, Omomyc, a dominant negative of MYC, impairing the bind of MYC/MAX complex to DNA on the CTR1 promoter, is able to counteract the copper-dependent effects, (C) as well as CTR1 silencing.

References

    1. Hordyjewska A, Ł Popiołek, Kocot J. ‘The many “‘faces’” of copper in medicine and treatment. BioMetals. 2014;27:611–621. https://doi.org/10.1007/s10534-014-9736-5. - DOI - PMC - PubMed
    1. Lowe J, Taveira-da-Silva R, Hilário-Souza E. Dissecting copper homeostasis in diabetes mellitus. IUBMB Life. 2017;69:255–262. https://doi.org/10.1002/iub.1614. - DOI - PubMed
    1. Morrell A, Tallino S, Yu L, Burkhead JL. The role of insufficient copper in lipid synthesis and fatty-liver disease. IUBMB Life. 2017;69:263–270. https://doi.org/10.1002/iub.1613. - DOI - PMC - PubMed
    1. Wachsmann J, Peng F. Molecular imaging and therapy targeting copper metabolism in hepatocellular carcinoma. World Journal of Gastroenterology. 2016;22:221–31. https://doi.org/10.3748/wjg.v22.i1.221. - DOI - PMC - PubMed
    1. Wee NK, Weinstein DC, Fraser ST, Assinder SJ. The mammalian copper transporters CTR1 and CTR2 and their roles in development and disease. Int J Biochem Cell Biol. 2013;45:960–3. https://doi.org/10.1016/j.biocel.2013.01.018. - DOI - PubMed