. 2018 Jan 30:4:5.
doi: 10.1038/s41421-017-0005-y. eCollection 2018.

Long non-coding RNA MT1DP shunts the cellular defense to cytotoxicity through crosstalk with MT1H and RhoC in cadmium stress

Affiliations

Long non-coding RNA MT1DP shunts the cellular defense to cytotoxicity through crosstalk with MT1H and RhoC in cadmium stress

Ming Gao et al. Cell Discov. .

Abstract

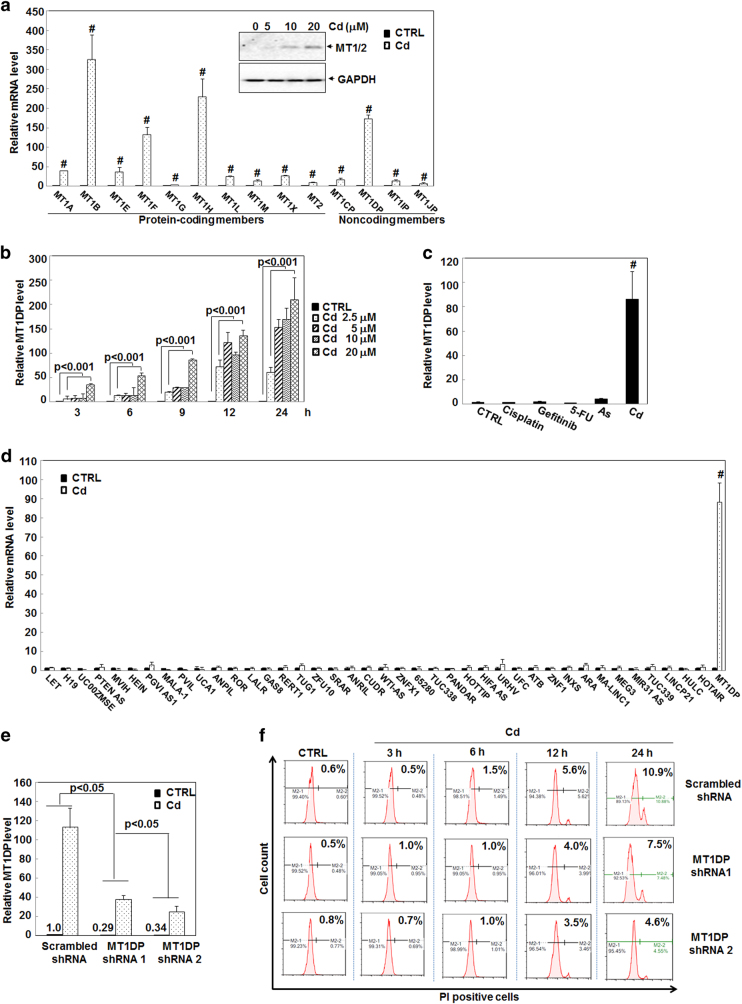
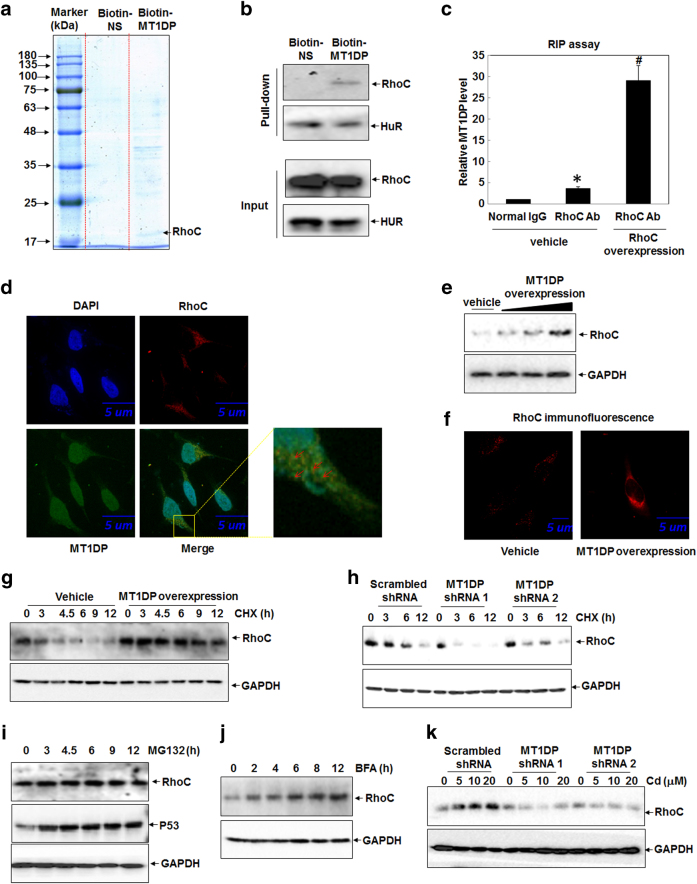
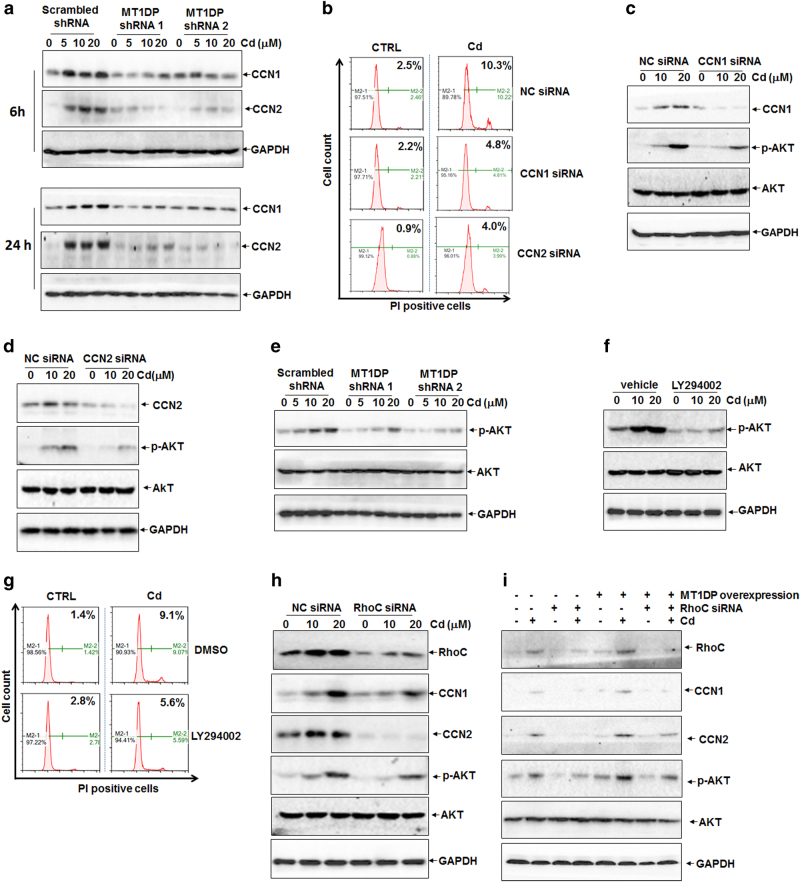
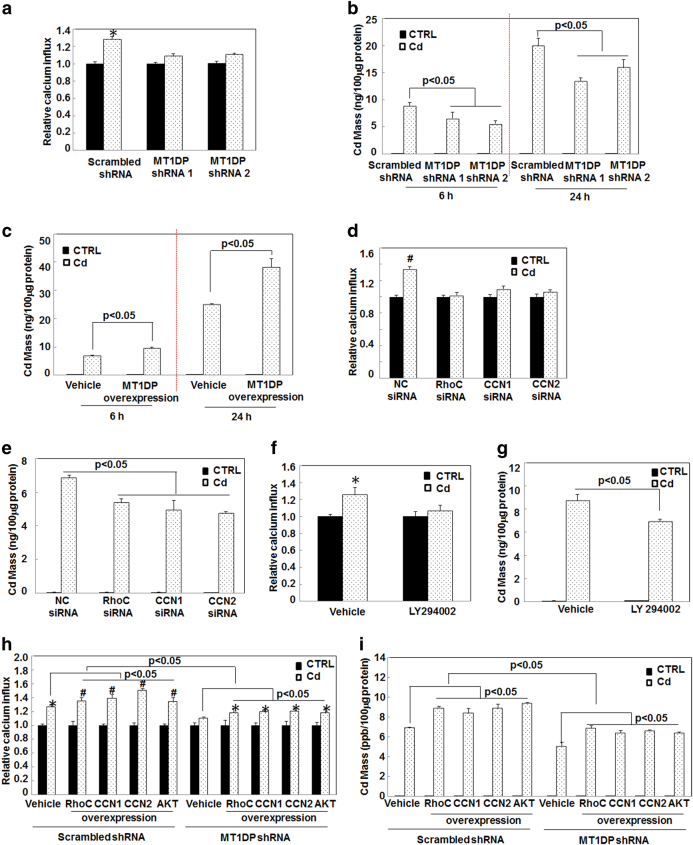
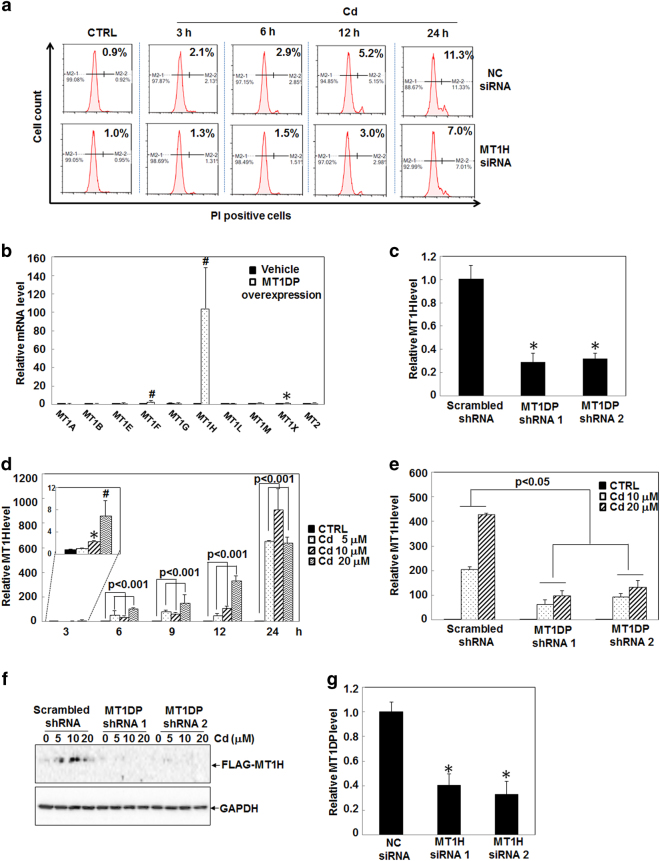
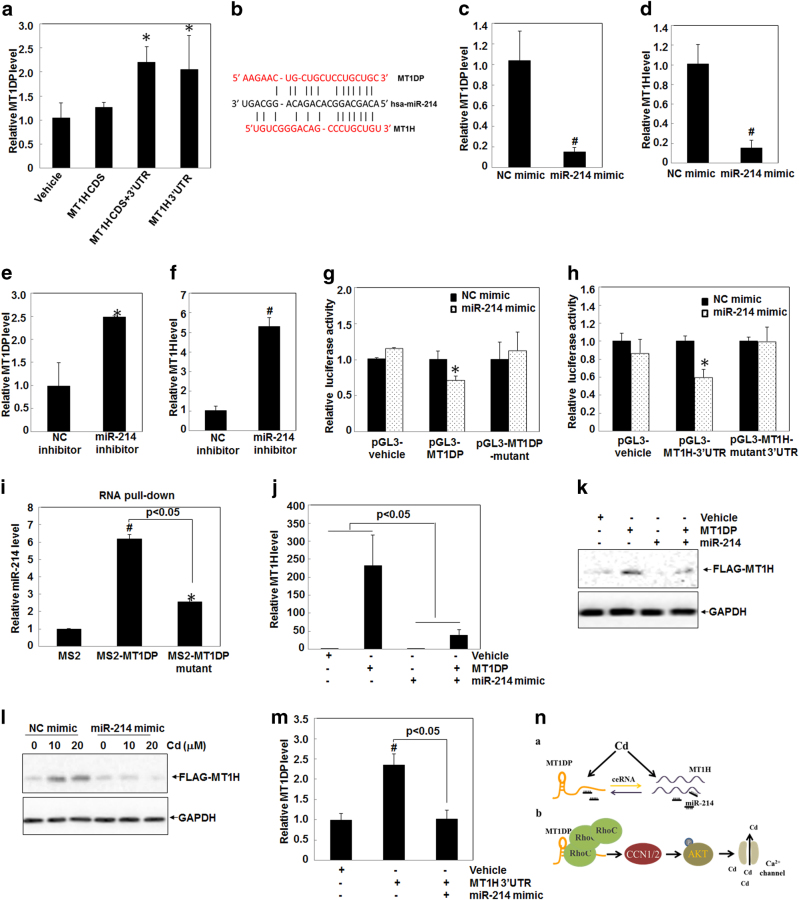
Metallothioneins (MTs) are known to protect cells against oxidative stress, especially providing protection against cadmium (Cd) toxicity in hepatocytes. There are various gene variants and pseudogenes for MTs; however, there is little understanding on the functions of those non-coding MT members that are known to be expressed as long non-coding RNAs (lncRNAs) nowadays. Different from most protein-coding MT members, MT1DP was here found that remarkably induced to provoke cytotoxicity in hepatocytes in response to Cd treatment. MT1DP exerted such a pro-apoptotic function in Cd-treated hepatocytes through interacting with two partners: RhoC and MT1H. On one hand, MT1DP interacted with RhoC protein to increase the latter's stability by preventing lysosome-dependent protein degradation. Therefore, upon Cd stress, MT1DP/RhoC complex was quickly reinforced to activate RhoC-CCN1/2-AKT signaling and potentiate Ca2+ influx, leading to enhanced Cd uptake and elevated Cd toxicity. On the other hand, MT1H, a protein-coding member of the MT family with little known function, was found to quickly respond to Cd exposure along with MT1DP. Mechanistically, MT1H and MT1DP were uncovered to mutually protect each other through a reciprocal ceRNA mechanism, building up a positive feedback loop to enforce MT1DP-conducted signaling upon Cd exposure. Moreover, MT1DP was found to contribute much more to the activation of RhoC-CCN1/2-AKT signaling than MT1H. Considered together, we here unveiled a mystery whether a pseudogene within the MT family, MT1DP, has actual biological functions in regulating Cd-induced cellular defense. Our findings unearthed an important role of pseudogene MT1DP in calibrating the cellular machinery to switch the cellular defense to cytotoxicity through crosslinking an interplay between its two partners, namely MT1H and RhoC, under cadmium stress.


Conflict of interest statement

The authors declare that they have no conflict of interest.

Figures

Fig. 1
Fig. 1. MT1DP induction promotes Cd-induced cell death.
a Relative expression levels of MT members in HepG2 cells treated with Cd at 20 μmol/L for 24 h. Inserted panel, western blot analysis of MT1/2 proteins in HepG2 cells treated with Cd for 24 h. b MT1DP levels upon exposure to Cd at various concentrations over time determined by qRT-PCR (n = 3). c Relative expression levels of MT1DP in HepG2 cells upon treatment with 2 μg/mL cisplatin, 5 μM/mL gefitinib, 50 μg/mL 5-FU, 10 μmol/L arsenic (As), and 20 μmol/L Cd through qRT-PCR assay (n = 3). d Expression changes of lncRNAs in HepG2 cells exposed to 10 μmol/L Cd for 24 h, as characterized by qRT-PCR analysis (n = 3). e Relative expression levels of MT1DP in MT1DPlow cells. The endogenous MT1DP was stably knocked down in HepG2 cells, as evidenced by qRT-PCR assay (n = 3), with relative expression levels labeled above the bars for MT1DP-shRNA #1 and MT1DP-shRNA #2 transfectants. Expression changes of MT1DP in cells responded to Cd at 20 μmol/L were also detected by qRT-PCR (n = 3). f The proportions of PI-positive in scrambled-shRNA control cells and MT1DP-low cells in response to 20 μmol/L Cd for 3, 6, 12 and 24 h, determined by flow cytometry analysis (n = 3)
Fig. 2
Fig. 2. MT1DP interacts with RhoC and increases its protein stability to reinforce cell death upon Cd treatment.
a MT1DP partners were surveyed by RNA-pull-down assay and mass spectrometry. b Western blot analysis of RhoC protein concentrations in biotin-MT1DP and biotin-NS pull-down complexes. NS denotes non-sense RNA probes. c RIP assay was performed to determine the binding of RhoC with MT1DP RNA. The enrichment of MT1DP RNA was measured by qRT-PCR assay in normal IgG pull-down complex from vehicle control cells and anti-RhoC Ab pull-down complexes from vehicle control and RhoC overexpression cells, respectively (n = 3). d The fluorescence of RhoC (in red) and MT1DP (in green) was visualized by confocal microscopy. The red arrows indicate the overlapping (shown in yellow) between RhoC protein fluorescence and MT1DP RNA fluorescence. Nuclei are shown in blue through staining with DAPI. e HepG2 cells were transfected with increasing concentrations of MT1DP overexpression constructs for 24 h, and thereafter the protein contents of RhoC were determined by western blotting. f RhoC protein fluorescence (shown in red) was detected by confocal microscopy in vehicle control and MT1DP overexpression cells. g Western blot analysis of the protein levels of RhoC in vector control and MT1DP overexpression cells in response to 40 μmol/L CHX over the time course. h RhoC protein concentrations in scrambled control and MT1DPlow cells treated with 40 μmol/L CHX over time, detected by western blot analysis. HepG2 cells were treated with 20 μmol/L MG132 i and 10 nmol/L BFA j over time, and then the protein levels of RhoC and p53 were determined by western blot. k The protein content of RhoC in scrambled control and MT1DPlow cells in response to Cd for 6 h, determined by western blot analysis
Fig. 3
Fig. 3. CCN1/2-AKT pathway is downstream of MT1DP/RhoC complex to reinforce Cd toxicity.
a Western blot analysis of the protein concentrations of CCN1 and CCN2 in scrambled control and MT1DPlow HepG2 cells in response to Cd at indicated concentrations for 6 and 24 h. b Flow cytometry analysis of cell death with PI staining in cells after knocking down the endogenous CCN1 and CCN2 expression by specific siRNAs with or without Cd treatment at 20 μmol/L for 24 h. c Protein levels of CCN1 and phosphorylated AKT in NC-siRNA and CCN1-siRNA transfected cells in response to Cd. d CCN2 and phosphorylated AKT concentrations were compared by western blot assay in NC-siRNA and CCN2-siRNA transfected cells under Cd treatment. e Western blot analysis of phosphorylation of AKT in scrambled control and MT1DPlow cells under the treatment. f, g HepG2 cells were pretreated with a selective inhibitor against AKT (LY294002, 20 μmol/L) for 1 h, and then cells were treated with Cd, followed by determination of AKT phosphorylation through western blotting for 6-h Cd treatment f and cell death through flow cytometry analysis for 24-h Cd treatment. h Protein levels of RhoC, CCN1, CCN2 and phosphorylated AKT in NC-siRNA and RhoC-siRNA transfected cells upon Cd treatment for 6 h, as reflected by western blot analysis. i HepG2 cells were transfected with RhoC selective siRNA molecules for 24 h, followed by transfection of MT1DP overexpression constructs for another 24 h, and cells were then treated with 20 μmol/L Cd for 6 h. Finally, cells were collected for western blotting analysis of RhoC, CCN1, CCN2, phosphorylated AKT and total AKT concentrations
Fig. 4
Fig. 4. MT1DP/RhoC-CCN1/2-AKT pathway enforces Ca2+ influx and cellular uptake of Cd.
a Scrambled control and MT1DPlow cells were pretreated with Cd at 20 μmol/L for 6 h, and then added with 5 μM Fluo-3AM for 1 h, followed by determination of cellular Ca2+ influx (n = 6). b Intracellular Cd mass in scrambled control and MT1DPlow cells in response to Cd at 20 μmol/L for 6 and 24 h, assayed by ICP-MS assay (n = 4). c Intracellular Cd content in vehicle control and MT1DP overexpression cells treated with Cd at 20 μmol/L for 6 and 24 h, measured by ICP-MS assay (n = 4). (d, e) Cellular Ca2+ influx d and mass e in NC-siRNA, RhoC-siRNA, CCN1-siRNA and CCN2-siRNA-transfected cells responding to Cd at 20 μmol/L for 6 h, determined by multiscan spectrometry (n = 6) and ICP-MS assay (n = 4), respectively. f, g HepG2 cells were pretreated with LY294002 for 1 h, and then the cellular Ca2+ influx f and Cd mass g after treatment of Cd at 20 μmol/L for 6 h was examined by multiscan spectrometry (n = 6) and ICP-MS assay (n = 4), respectively. h, i Scrambled control cells and MT1DPlow cells were transfected with RhoC, CCN1, CCN2, and AKT overexpression constructs for 24 h prior to Cd treatment at 20 μmol/L for 6 h, and thereafter cellular Ca2+ influx h and Cd mass i were determined by multiscan spectrometry (n = 6) and ICP-MS assay (n = 4), respectively
Fig. 5
Fig. 5. MT1DP regulates its parental gene MT1H level through a ceRNA mechanism.
a Cell death analysis through flow cytometry analysis with PI staining in scrambled control and MT1Hlow cells upon Cd treatment at 20 μmol/L for 3, 6, 12, and 24 h (n = 3). b qRT-PCR analysis of relative mRNA levels of MT1 family numbers in MT1DP overexpressed HepG2 cells (n = 3). c qRT-PCR assay of MT1H expression levels in scrambled control and MT1DPlow cells (n = 3). d MT1H mRNA levels in HepG2 cells in response to Cd over time, determined by qRT-PCR (n = 3). e qRT-PCR determination of MT1H mRNA levels in scrambled control and MT1DPlow cells upon Cd treatment at 10 and 20 μmol/L Cd for 24 h (n = 3). f Exotic FLAG-MT1H CDS + 3ʹ-UTR construct was transfected into scrambled control and MT1DPlow cells for 24 h, and cells were treated with Cd at indicated concentrations for 6 h, followed by western blot analysis of FLAG-MT1H. g Endogenous MT1H mRNA levels were knocked down by two sets of selective siRNA molecules in HepG2 cells, and then MT1DP levels were assayed by qRT-PCR analysis (n = 3)
Fig. 6
Fig. 6. MT1DP competes for miR-214 with MT1H.
a HepG2 cells were transfected with exotic FLAG-MT1H CDS, FLAG-MT1H CDS + 3ʹ-UTR, and FLAG-MT1H 3ʹ-UTR for 24 h, respectively, and then the MT1DP levels were measured by qRT-PCR (n = 3). b A schematic illustrating the putative target sites for MT1DP and MT1H in competing for miR-214. cf Levels of MT1DP and MT1H were determined by qRT-PCR in cells transfected with NC-mimic and miR-214 mimic molecules c, d and NC-inhibitor and miR-214 inhibitor molecules e, f (n = 3), respectively. g, h Relative luciferase activities in HepG2 cells with expression of pGL3-vehicle, pGL3-MT1DP, and pGL3-MT1DP-mutant constructs g and pGL3-vehicle, pGL3-MT1H 3ʹ-UTR, and pGL3-MT1H 3ʹ-UTR-mutant constructs h upon transfection of NC-mimic and miR-214 mimic molecules, measured through the dual-luciferase assay (n = 3). i Relative enrichment of miR-214 in the pull-down lysates from cells using MS2-MT1DP and MS2-MT1DP mutant RNAs, respectively, examined by qRT-PCR assay (n = 3). Fold changes were normalized to U6 RNA levels. j The MT1H levels in HepG2 cells transfected with synthesized molecules of vehicle control, MT1DP, miR-214 and MT1DP + miR-214, detected by qRT-PCR assay (n = 3). k Western blot analysis of FLAG-MT1H in HepG2 cells. Cells were pre-transfected with FLAG-MT1H CDS + 3ʹ-UTR for 24 h, and were further transfected with synthesized molecules of vehicle control, MT1DP, miR-214 and MT1DP + miRNA-214 for another 24 h, followed by western blotting. l Similar to k, after pre-transfection of FLAG-MT1H CDS + 3ʹ-UTR for 24 h, changes of MT1H concentrations upon NC-mimic and miR-214 mimic molecules were determined by western blot analysis under Cd treatment at 20 μmol/L for 6 h. m qRT-PCR analysis of MT1DP levels in HepG2 cells transfected with MT1H 3ʹ-UTR and MT1H 3ʹ-UTR + miR-214 (n = 3). n A working model depicting the interplay of MT1DP with MT1H and RhoC to promote Cd-induced cellular toxicity

Similar articles

Cited by

References

    1. Jaishankar M, Tseten T, Anbalagan N, Mathew BB, Beeregowda KN. Toxicity, mechanism and health effects of some heavy metals. Interdiscip. Toxicol. 2014;7:60–72. doi: 10.2478/intox-2014-0009. - DOI - PMC - PubMed
    1. Jomova K, Valko M. Advances in metal-induced oxidative stress and human disease. Toxicology. 2011;283:65–87. doi: 10.1016/j.tox.2011.03.001. - DOI - PubMed
    1. Tang Y, et al. Autophagy protects intestinal epithelial cells against deoxynivalenol toxicity by alleviating oxidative stress via IKK signaling pathway. Free Radic. Biol. Med. 2015;89:944–951. doi: 10.1016/j.freeradbiomed.2015.09.012. - DOI - PubMed
    1. Waldron KJ, Rutherford JC, Ford D, Robinson NJ. Metalloproteins and metal sensing. Nature. 2009;460:823–830. doi: 10.1038/nature08300. - DOI - PubMed
    1. Thirumoorthy N, Manisenthil Kumar KT, Shyam Sundar A, Panayappan L, Chatterjee M. Metallothionein: an overview. World J. Gastroenterol. 2007;13:993–996. doi: 10.3748/wjg.v13.i7.993. - DOI - PMC - PubMed

LinkOut - more resources