. 2018 Feb 24:4:11.
doi: 10.1038/s41540-018-0047-2. eCollection 2018.

Population-based mechanistic modeling allows for quantitative predictions of drug responses across cell types

Affiliations

Population-based mechanistic modeling allows for quantitative predictions of drug responses across cell types

Jingqi Q X Gong et al. NPJ Syst Biol Appl. .

Abstract

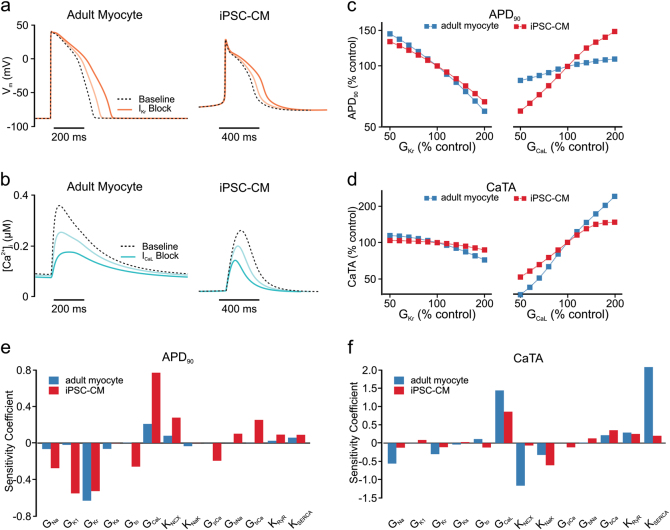
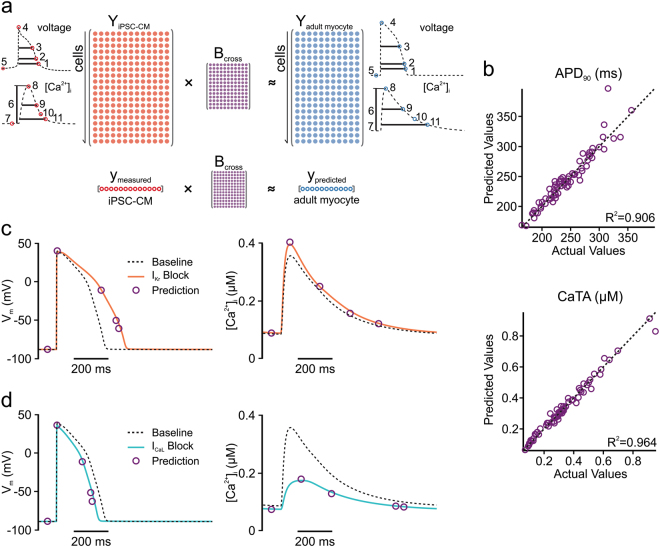
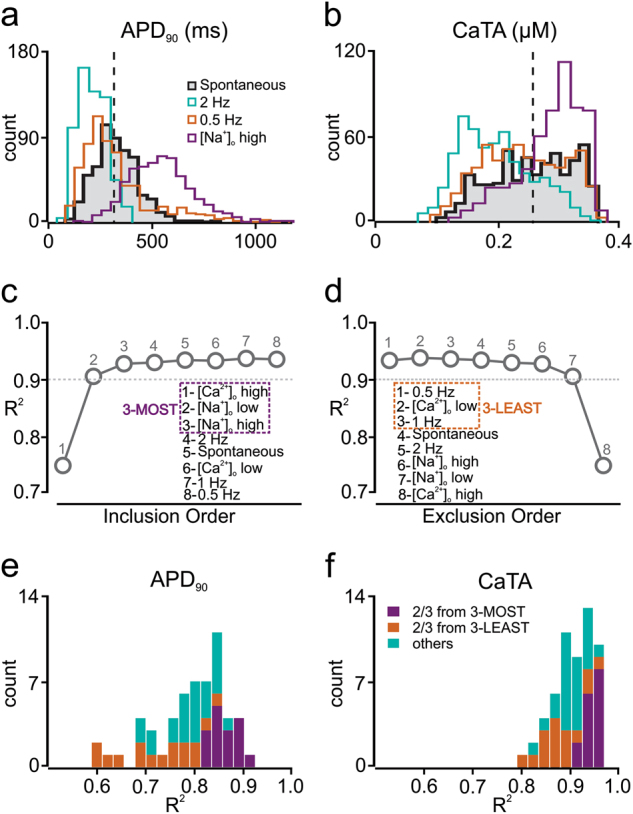
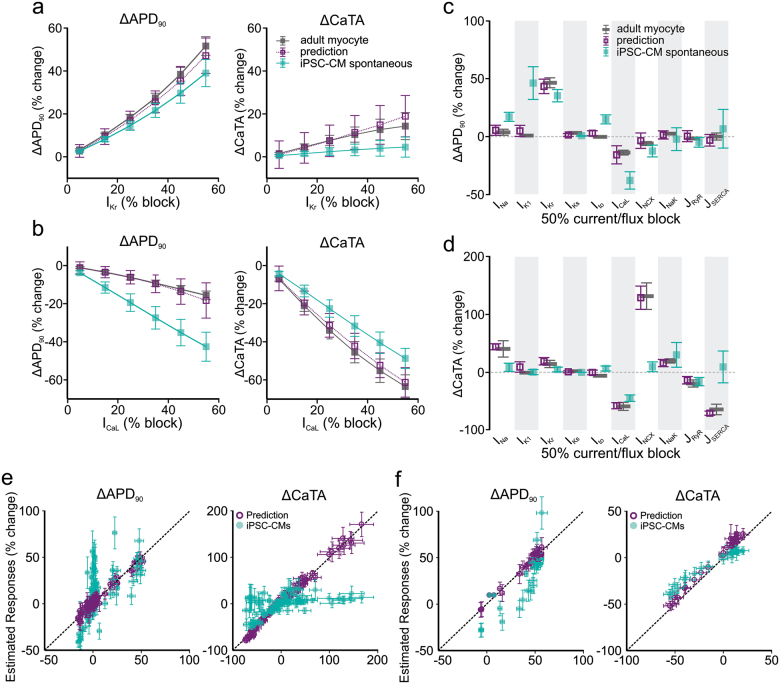
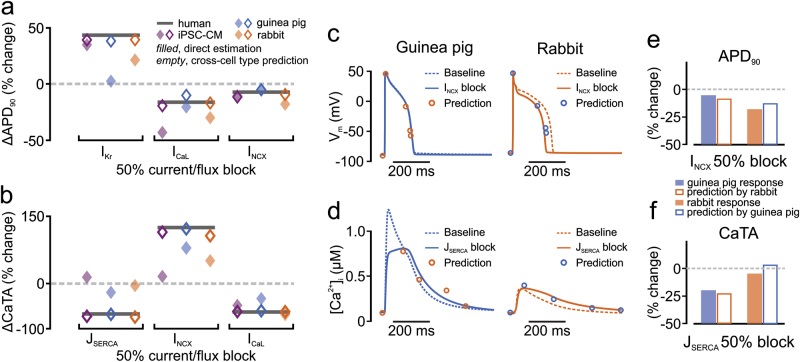
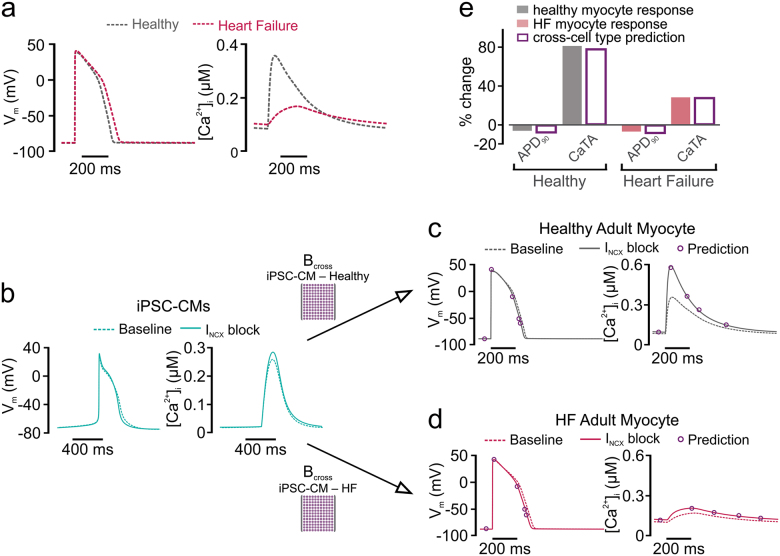
Quantitative mismatches between human physiology and experimental models can be problematic for the development of effective therapeutics. When the effects of drugs on human adult cardiac electrophysiology are of interest, phenotypic differences with animal cells, and more recently stem cell-derived models, can present serious limitations. We addressed this issue through a combination of mechanistic mathematical modeling and statistical analyses. Physiological metrics were simulated in heterogeneous populations of models describing cardiac myocytes from adult ventricles and those derived from induced pluripotent stem cells (iPSC-CMs). These simulated measures were used to construct a cross-cell type regression model that predicts adult myocyte drug responses from iPSC-CM behaviors. We found that (1) quantitatively accurate predictions of responses to selective or non-selective ion channel blocking drugs could be generated based on iPSC-CM responses under multiple experimental conditions; (2) altering extracellular ion concentrations is an effective experimental perturbation for improving the model's predictive strength; (3) the method can be extended to predict and contrast drug responses in diseased as well as healthy cells, indicating a broader application of the concept. This cross-cell type model can be of great value in drug development, and the approach, which can be applied to other fields, represents an important strategy for overcoming experimental model limitations.


Conflict of interest statement

The authors declare no competing interests.

Figures

Fig. 1
Fig. 1
Human adult myocyte and human iPSC-CM responses to perturbations in ion transport pathways. a Action potential (AP) waveforms simulated in human adult myocyte and iPSC-CM mathematical models before (dashed lines) and after (solid lines) 25 and 50% block of IKr. b Calcium transient (CaT) time courses of the two cell types at baseline (dashed lines), and after 25 and 50% block of ICaL (solid lines). c, d Quantification of AP duration at 90% repolarization (APD90, c) and CaT amplitude (CaTA, d) as a function of maximal conductances controlling IKr (GKr, left) and ICaL (GCaL, right) in adult myocyte (blue) and iPSC-CM (red) models. All variables are expressed as a percentage of the control value obtained in the absence of perturbation. e, f Sensitivity coefficients indicating the extent to which perturbations in each ion transport pathway causes changes in APD90 (e) and CaTA (f). Coefficients are shown for both adult myocyte (blue) and iPSC-CM (red) models
Fig. 2
Fig. 2
Regression model to predict adult myocyte responses from iPSC-CM physiology. a Upper panel, regression strategy for development of a cross-cell type model that maps physiological responses from one cell type (iPSC-CM, left) to another cell type (adult myocyte, right). Bottom panel, the use of cross-cell type model to predict drug responses with measurements from simulations or experiments. The resulting regression matrix Bcross serves to generate predictions on adult myocyte responses when measurements are made in iPSC-CM following the same perturbations. Insets: physiological features quantified from iPSC-CM (left) and adult myocyte (right) simulations. AP features (top): (1) AP duration (APD) at −60 mV; (2) APD at 90% repolarization (APD90); (3) APD at 50% repolarization (APD50); (4) peak membrane voltage (Vpeak); (5) resting membrane voltage (Vrest). CaT features (bottom): (6) CaT amplitude (CaTA); (7) resting [Ca2+]i (Carest); (8) peak [Ca2+]i (Capeak); (9) CaT duration (CaD) at 50% return to baseline (CaD50); (10) CaT decay time; (11) CaT duration (CaD) at 90% return to baseline (CaD90). For simulations of iPSC-CM spontaneous (rather than electrically paced) activity, the beating frequency was also quantified and included in the regression model. b Scatter plots of predictions for adult myocyte APD90 (top) and CaTA (bottom), with the actual values from adult myocyte simulations (abscissa) vs. the cross-cell type predictions (ordinate). For clarity, only 100 samples are shown on each of the plots, but the regression was constructed with 600 cell populations, and five-fold cross-validation was performed to calculate R2 values. c, d Adult myocyte AP and CaT responses to 50% block of IKr (c) and ICaL (d). Purple circles represent regression model predictions of particular waveform features, whereas solid lines indicate numerical simulations
Fig. 3
Fig. 3
Selection of the most informative iPSC-CM simulation protocols for regression model optimization. a, b Histograms indicating how APD90 (a) and CaTA (b) vary across a heterogeneous population of iPSC-CMs under different simulated experimental conditions. The black, shaded histogram, representing population behavior with baseline spontaneous contraction is compared with alternative experimental conditions such as 0.5 Hz electrical stimulation (0.5 Hz, orange), 2 Hz electrical stimulation (2.0 Hz, green), and increased (300 mM) extracellular [Na+] ([Na+]o high, purple). c, d Averaged R2 values across all predicted features with five-fold cross-validation, with different numbers of experimental conditions for sequential inclusion (c) and sequential exclusion (d) methods. These procedures identified the three most informative protocols (3-MOST, purple dash square, left) and the three least informative protocols (3-LEAST, orange dash square, right). e, f Distributions of adjusted R2 values for APD90 (e) and CaTA (f) of the 56 regression models that can be built by randomly choosing three protocols from the initial set of eight. Regression models that select two or more protocols from the 3-MOST list (purple) exhibit better predictive power than models that select two or more protocols from the 3-LEAST list (orange)
Fig. 4
Fig. 4
Regression model predictions of adult myocyte responses to selective and non-selective ion channel blockers. Simulations were performed in adult myocyte and iPSC-CM models to assess effects of selective (a–d) and non-selective ion channel blockers (e, f). In all cases, simulations were performed with heterogeneous populations of 100 cells; symbols and error bars represent mean and standard deviation, respectively. a, b Simulated selective block of IKr (a) and ICaL (b) varying from 5–55% channel blockade. Responses of APD90 (left) and CaTA (right) are shown. In each panel, the simulated iPSC-CM response with baseline spontaneous contraction is shown in cyan, the simulated adult myocyte response is shown in dark gray, and the regression model prediction is shown in purple. c, d Simulated selective block (50%) of 10 ion transport pathways, with colors as described for a and b. Simulated drug-induced changes are presented as percent changes in APD90 (c) and CaTA (d). e, f Simulations were performed to assess effects of 90 hypothetical drugs that block two ion transport pathways with different potencies (e) and 30 real drugs that target up to five cardiac ion channels (f). For drug effects on APD90 (left) and CaTA (right), simulated adult myocyte responses (abscissa) are plotted vs. estimated responses (ordinate), either directly from iPSC-CM responses under spontaneous contraction (cyan-filled symbols) or from cross-cell type regression model predictions (purple empty symbols). Coefficient of determination (R2) was calculated to demonstrate the predictive accuracy. Taking together the 120 drugs simulated, for cross-cell type predictions, R2 = 0.9748 and 0.9858 for APD90 and CaTA, respectively. For iPSC-CM spontaneous responses, R2 = 0.0156 and 0.2763 for APD90 and CaTA, respectively
Fig. 5
Fig. 5
Extension of the cross-cell type regression model concept to additional cell types. a, b Adult myocyte responses to 50% current/flux block (dark gray bars) were predicted from three alternative cell types: iPSC-CM (purple symbols), guinea pig ventricular myocyte (blue symbols), rabbit ventricular myocyte (orange symbols). In each case, filled symbols represent the direct estimate from alternative cell type responses, whereas open symbols represent the cross-cell type regression model predictions. Three ion transport pathways that had large effects in adult myocytes on either APD90 (a) or CaTA (b) are shown. c Effects of 50% INCX block on guinea pig and rabbit ventricular action potentials. d Effects of 50% JSERCA block on guinea pig and rabbit ventricular Ca2+ transients. In each case, baseline traces are dashed, perturbed traces are solid, and open circles represent the cross-cell type predictions of waveform features. e, f Quantification of the results shown in c and d
Fig. 6
Fig. 6
Cross-cell type modeling to predict drug responses in diseased adult myocytes. a Action potential (AP, left) and Ca2+ transient (CaT, right) simulated in the adult myocyte model, with parameters varied to reproduce a heart failure (HF) phenotype, as previously done. b Recordings made in iPSC-CMs can be used to predict drug responses in either healthy adult (top) or failing adult (bottom) myocytes, using alternative regression models. c Regression model accurately predicts that block of INCX by 40% causes minimal AP shortening and a large increase in CaT amplitude in healthy adult myocytes. d Regression model accurately predicts that block of INCX by 40% causes minimal AP shortening and a mild increase in CaT amplitude in failing adult myocytes. e Quantification of the effects observed in c and d, indicating that cross-cell type model variants can accurately predict drug responses in healthy and diseases populations of adult myocytes. Filled bars represent direct simulations, gray for healthy and pale red for failing. Empty bars are regression model predictions

Similar articles

Cited by

References

    1. Gibson JK, Yue Y, Bronson J, Palmer C, Numann R. Human stem cell-derived cardiomyocytes detect drug-mediated changes in action potentials and ion currents. J. Pharmacol. Toxicol. Methods. 2014;70:255–267. doi: 10.1016/j.vascn.2014.09.005. - DOI - PubMed
    1. Doherty KR, et al. Structural and functional screening in human induced-pluripotent stem cell-derived cardiomyocytes accurately identifies cardiotoxicity of multiple drug types. Toxicol. Appl. Pharmacol. 2015;285:51–60. doi: 10.1016/j.taap.2015.03.008. - DOI - PubMed
    1. Li S, Chen G, Li RA. Calcium signalling of human pluripotent stem cell-derived cardiomyocytes. J. Physiol. 2013;591:5279–5290. doi: 10.1113/jphysiol.2013.256495. - DOI - PMC - PubMed
    1. van den Heuvel NH, van Veen TA, Lim B, Jonsson MK. Lessons from the heart: mirroring electrophysiological characteristics during cardiac development to in vitro differentiation of stem cell derived cardiomyocytes. J. Mol. Cell. Cardiol. 2014;67:12–25. doi: 10.1016/j.yjmcc.2013.12.011. - DOI - PubMed
    1. Marder E, Taylor AL. Multiple models to capture the variability in biological neurons and networks. Nat. Neurosci. 2011;14:133–138. doi: 10.1038/nn.2735. - DOI - PMC - PubMed