Inulin-type fructan improves diabetic phenotype and gut microbiota profiles in rats
- PMID: 29507837
- PMCID: PMC5835350
- DOI: 10.7717/peerj.4446
Inulin-type fructan improves diabetic phenotype and gut microbiota profiles in rats
Abstract
Background & aims: Accumulating research has addressed the linkage between the changes to gut microbiota structure and type 2 diabetes (T2D). Inulin is one type of soluble dietary fiber that can alleviate T2D. As a prebiotic, inulin cannot be digested by humans, but rather is digested by probiotics. However, whether inulin treatment can benefit the entire gut bacteria community remains unknown. In this study, we evaluated the differences in gut microbiota composition among diabetic, inulin-treated diabetic, normal control, and inulin-treated normal control rats.
Methods: A diabetic rat model was generated by a high-fat diet and streptozotocin injections (HF/STZ). Inulin was orally administered to normal and diabetic rats. To determine the composition of the gut microbiota, fecal DNA extraction and 16S rRNA gene 454 pyrosequencing were performed.
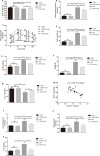
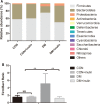
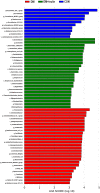
Results: We found that inulin treatment reduced fasting blood glucose levels and alleviated glucose intolerance and blood lipid panels in diabetic rats. Additionally, inulin treatment increased the serum glucagon-like peptide-1 (GLP-1) level, reduced serum IL-6 level, Il6 expression in epididymal adipose tissue, and Pepck, G6pc expression in liver of diabetic rats. Pyrophosphate sequencing of the 16s V3-V4 region demonstrated an elevated proportion of Firmicutes and a reduced abundance of Bacteroidetes at the phylogenetic level in diabetic rats compared to normal control rats. The characteristics of the gut microbiota in control and inulin-treated rats were similar. Inulin treatment can normalize the composition of the gut microbiota in diabetic rats. At the family and genus levels, probiotic bacteria Lactobacillus and short-chain fatty acid (SCFA)-producing bacteria Lachnospiraceae, Phascolarctobacterium, and Bacteroides were found to be significantly more abundant in the inulin-treated diabetic group than in the non-treated diabetic group. In addition, inulin-treated rats had a lower abundance of Desulfovibrio, which produce lipopolysaccharide (LPS). The abundance of Lachnospiraceae was negatively correlated with the blood glucose response after a glucose load.
Conclusion: In summary, diabetic rats have different gut microbiota from control rats. Inulin treatment can alleviate gut microbiota dysbiosis in T2D model rats. Moreover, inulin treatment enhanced serum GLP-1 level to suppress IL-6 secretion and production and hepatic gluconeogenesis, resulted in moderation of insulin tolerance.
Keywords: Diabetes; Gut microbiota; Inulin; Soluble fiber.
Conflict of interest statement
Dr. Xiaobing Yu is an employee of Fengning Ping’an High-tech Industrial Co., Ltd.
Figures


References
-
- Banzet S, Koulmann N, Simler N, Sanchez H, Chapot R, Serrurier B, Peinnequin A, Bigard X. Control of gluconeogenic genes during intense/prolonged exercise: hormone-independent effect of muscle-derived IL-6 on hepatic tissue and PEPCK mRNA. Journal of Applied Physiology. 2009;107:1830–1839. doi: 10.1152/japplphysiol.00739.2009. - DOI - PubMed
LinkOut - more resources
Full Text Sources
Other Literature Sources
Research Materials
Miscellaneous

