. 2018 Feb 9;2(3):270-284.
doi: 10.1002/hep4.1151. eCollection 2018 Mar.

Vinyl chloride dysregulates metabolic homeostasis and enhances diet-induced liver injury in mice

Affiliations

Vinyl chloride dysregulates metabolic homeostasis and enhances diet-induced liver injury in mice

Anna L Lang et al. Hepatol Commun. .

Abstract

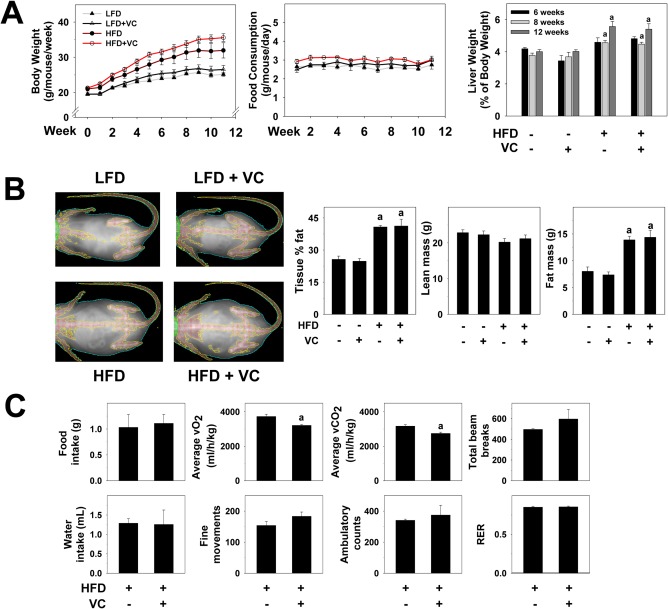
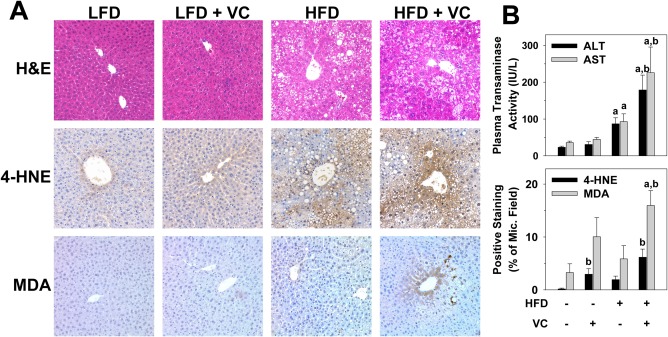
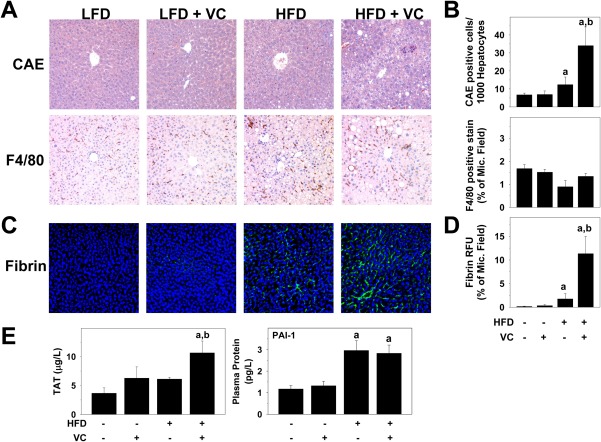
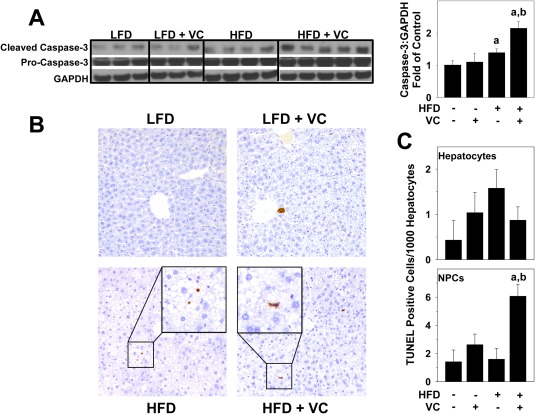
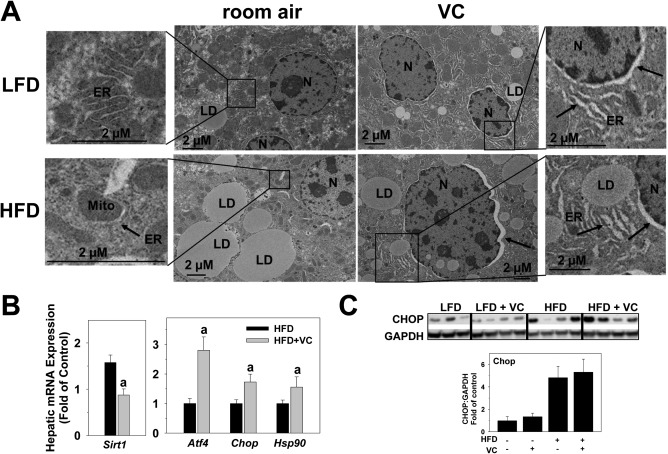
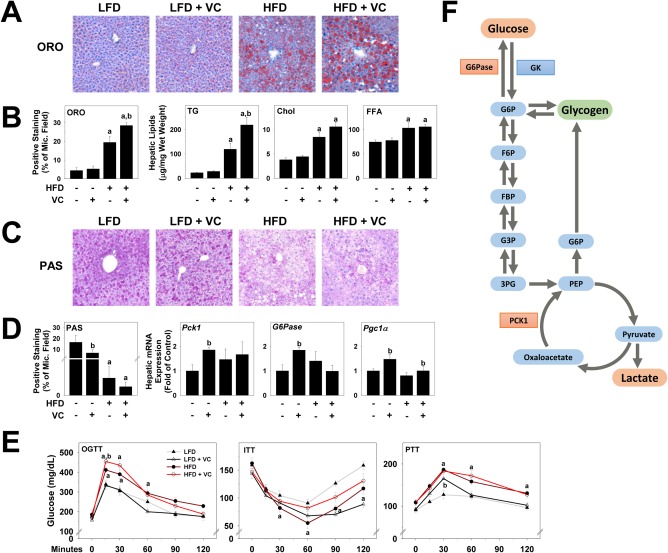
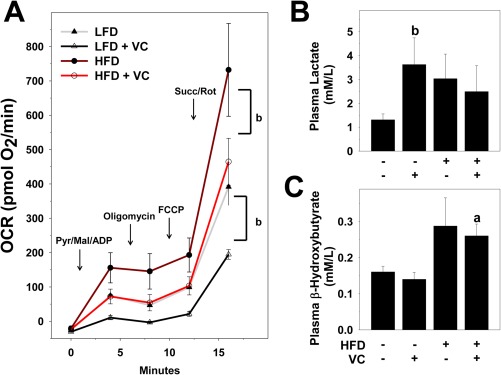
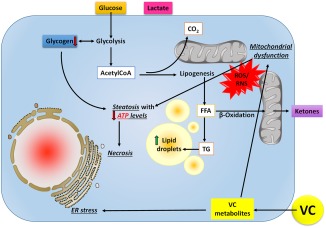
Vinyl chloride (VC), a common industrial organochlorine and environmental pollutant, has been shown to directly cause hepatic angiosarcoma and toxicant-associated steatohepatitis at high exposure levels. However, the impact of lower concentrations of VC on the progression of underlying liver diseases (e.g., nonalcoholic fatty liver disease [NAFLD]) is unclear. Given the high prevalence of NAFLD in the United States (and worldwide) population, this is an important concern. Recent studies by our group with VC metabolites suggest a potential interaction between VC exposure and underlying liver disease to cause enhanced damage. Here, a novel mouse model determined the effects of VC inhalation at levels below the current Occupational Safety and Health Administration limit (<1 ppm) in the context of NAFLD to better mimic human exposure and identify potential mechanisms of VC-induced liver injury. VC exposure caused no overt liver injury in mice fed a low-fat diet. However, in mice fed a high-fat diet (HFD), VC significantly increased liver damage, steatosis, and increased neutrophil infiltration. Moreover, VC further enhanced HFD-induced oxidative and endoplasmic reticulum stress. Importantly, VC exposure dysregulated energy homeostasis and impaired mitochondrial function, even in mice fed a low-fat diet. In toto, the results indicate that VC exposure causes metabolic stress that sensitizes the liver to steatohepatitis caused by HFD. Conclusion: The hypothesis that low-level (below the Occupational Safety and Health Administration limit) chronic exposure to VC by inhalation enhances liver injury caused by an HFD is supported. Importantly, our data raise concerns about the potential for overlap between fatty diets (i.e., Western diet) and exposure to VC and the health implications of this co-exposure for humans. It also emphasizes that current safety restrictions may be insufficient to account for other factors that can influence hepatotoxicity. (Hepatology Communications 2018;2:270-284).


Figures

Figure 1
Figure 1
Metabolic phenotype. (A) Body weights were measured once per week and are depicted for the 12‐week exposure period. Food consumption was measured twice per week for the 12‐week exposure period. Liver weight to body weight ratios were calculated for each group for each time point. (B) DEXAscan analysis was performed for all treatment groups at the 12‐week time point. Representative pictures are shown. Body mass is graphed as body fat in percentage of total tissue, lean body mass, and fat mass in grams. (C) Representative parameters of metabolic function are depicted for mice exposed to HFD ± VC. a P < 0.05 compared to LFD or HFD control. Results are presented as mean ± SEM. Sample size per group A‐C, n = 10‐12. Abbreviations: RER, respiratory exchange ratio; vCO2, carbon dioxide production; vO2, oxygen consumption.
Figure 2
Figure 2
VC enhanced liver damage caused by the HFD. (A) Representative photomicrographs of H&E (general morphology, ×200), 4‐HNE (oxidative stress, ×200), and MDA (oxidative stress, ×200) are shown at 12 weeks. (B) Plasma transaminase (ALT/AST) levels were determined for the 12‐week time point; image analysis for 4‐HNE and MDA are graphed as positive staining as percentage of microscope field. a P < 0.05 compared to LFD control; b P < 0.05 compared to absence of VC. Results are presented as mean ± SEM. Sample size per group, n = 5‐7. Abbreviations: 4‐HNE, 4‐hydroxynonenal; ALT, alanine aminotransferase; AST, aspartate aminotransferase; H&E, hematoxylin and eosin; MDA, malondialdehyde; Mic., microscope.
Figure 3
Figure 3
VC increased hepatic inflammatory cell infiltration. (A) Representative photomicrographs of CAE (neutrophils, ×200) and F4/80 (macrophages, ×200) stains are shown for the 12‐week time point. (B) CAE‐positive cells were counted and graphed as positive cells per 1,000 hepatocytes; image analysis for F4/80 is graphed as positive staining as percentage of microscope field. (C) Representative photomicrographs of fibrin (×200). (D) Image analysis for fibrin is graphed as relative fluorescence units as percent of microscope field. (E) Plasma TAT and protein concentrations of PAI‐1 are shown in μg/L and pg/L, respectively. a P < 0.05 compared to LFD control; b P < 0.05 compared to absence of VC. Results are presented as mean ± SEM. Sample size per group, n = 5‐7. Abbreviations: CAE, chloroacetate esterase; Mic., microscope; RFU, relative fluorescence unit.
Figure 4
Figure 4
Effect of VC on apoptosis. (A) Representative western blots and densitometric analysis for whole liver caspase‐3 protein are shown. (B) TUNEL staining was performed as described in Materials and Methods for the 12‐week samples. Representative photomicrographs are shown (magnification ×200). (C) TUNEL‐positive hepatocytes and NPCs were quantified as described in Materials and Methods and are expressed as TUNEL‐positive cells per 1,000 hepatocytes. a P < 0.05 compared to LFD control; b P < 0.05 compared to absence of VC. Results are presented as mean ± SEM. Sample size per group, n = 5‐7. Abbreviation: GAPDH, glyceraldehyde 3‐phosphate dehydrogenase.
Figure 5
Figure 5
VC caused ER stress. (A) Representative electron microscope photomicrographs are shown. Arrows denote dilated ER, including the nuclear membrane as part of the ER membrane. (B) Representative western blot and densitometric analysis of CHOP are shown. (C) Hepatic mRNA expression of ER stress markers Sirt1, Atf4, Chop, and Hsp90 are shown for HFD and HFD + VC (12 weeks). a P < 0.05 compared to HFD control. Results are presented as mean ± SEM. Sample size per group A, n = 10; B,C, n = 5‐7. Abbreviations: GAPDH, glyceraldehyde 3‐phosphate dehydrogenase; LD, lipid droplet; Mito, mitochondria; N, nucleus.
Figure 6
Figure 6
VC dysregulated hepatic metabolism. (A) Representative photomicrographs of ORO (neutral lipids, ×200) are shown. (B) Image analysis of ORO‐positive staining was performed, and results are shown as percentage of microscope field. Triglyceride, cholesterol, and FFA levels were measured in hepatic lipid extracts as described in Materials and Methods. (C) Representative photomicrographs for PAS staining are shown for the 12‐week time point (glycogen, ×200). (D) Image analysis of PAS‐positive staining was performed, and results are shown as percentage of microscope field. Hepatic mRNA expression of Pck1, G6Pase, and Pgc1α are shown as fold change compared to LFD control animals at the 6‐week time point. (E) OGTT, ITT, and PTT were performed at 6 weeks of exposure. (F) Changes in glucose metabolism are represented. Red denotes increased expression or abundance with VC, while green denotes decrease in product levels. a P < 0.05 compared to LFD control; b P < 0.05 compared to absence of VC. Results are presented as mean ± SEM. Sample size per group A, n = 5‐7; B,C, n = 10‐12; E, n = 5. Abbreviations: 3PG, 3‐phosphoglycerate; Chol, cholesterol; F6P, fructose‐6‐phosphate; FBP, fructose 1,3‐bisphosphate; G3P, glyceraldehyde 3‐phosphase; G6P, glucose‐6‐phosphate; ITT, insulin tolerance test; Mic., microscope; OGTT, oral glucose tolerance test; PEP, phosphoenolpyruvate; PTT, pyruvate tolerance test; TG, triglyceride.
Figure 7
Figure 7
VC decreased mitochondrial respiration. (A) Seahorse analysis of isolated hepatic mitochondria at 6 weeks of exposure. (B) Lactate levels were determined from plasma samples at 12 weeks of exposure. (C) Plasma β‐hydroxybutyrate concentrations were determined as an index for ketone bodies for the 12‐week time point. a P < 0.05 compared to LFD control; b P < 0.05 compared to absence of VC. Results are presented as mean ± SEM. Sample size per group A, n = 5; B,C, n = 10‐12. Abbreviations: ADP, adenosine diphosphate; FCCP, carbonyl cyanide‐4‐(trifluoromethoxy)phenylhydrazone; Mal, malondialdehyde; Pyr, pyruvate; Rot, rotenone; Succ, succinate.
Figure 8
Figure 8
Working hypothesis. Upon exposure to VC, reactive intermediates form although biological activation processes and diet‐induced obesity decrease their elimination. Through carbonyl stress and the generation of reactive oxygen and nitrogen species, VC metabolites cause ER stress leading to mitochondrial damage, which impairs oxidative phosphorylation; the cell increases flux through glycolysis to compensate for this loss of ATP yield. The increased demand for glucose depletes glycogen stores. Acetyl‐CoA is shunted to lipid synthesis (causing steatosis) rather than β‐oxidation, even under conditions of ATP depletion, resulting in an increase in lactate production. The combined metabolic stress of VC exposure and ATP depletion likely causes liponecrosis associated with increased oxidative stress, ER stress, and inefficient mitochondrial respiration and energy production. Abbreviations: ATP, adenosine triphosphate; CoA, coenzyme A; RNS, reactive nitrogen species; ROS, reactive oxygen species; TG, triglyceride.

References

    1. Agency for Toxic Substances and Disease Registry (ATSDR) . Toxicological profile for vinyl chloride. Atlanta, GA: U.S. Department of Health and Human Services, Public Health Service; 2006.
    1. Sass JB, Castleman B, Wallinga D. Vinyl chloride: a case study of data suppression and misrepresentation. Environ Health Perspect 2005;113:809‐812. - PMC - PubMed
    1. International Agency for Research on Cancer . IARC Monographs on the Evaluation of Carcinogenic Risks to Humans. 1,3‐Butadiene, ethylene oxide and vinyl halides (vinyl fluoride, vinyl chloride and vinyl bromide). 2008;97:311‐426. - PMC - PubMed
    1. Kielhorn J, Melber C, Wahnschaffe U, Aitio A, Mangelsdorf I. Vinyl chloride: still a cause for concern. Environ Health Perspect 2000;108:579‐588. - PMC - PubMed
    1. McKone TE, Knezovich JP. The transfer of trichloroethylene (TCE) from a shower to indoor air: experimental measurements and their implications. J Air Waste Manage Assoc 1991;41:282‐286. - PubMed