Multicenter Study
. 2018 Jun 1;75(6):681-689.
doi: 10.1001/jamaneurol.2018.0035.

Association of Regulatory T-Cell Expansion With Progression of Amyotrophic Lateral Sclerosis: A Study of Humans and a Transgenic Mouse Model

Affiliations
Multicenter Study

Association of Regulatory T-Cell Expansion With Progression of Amyotrophic Lateral Sclerosis: A Study of Humans and a Transgenic Mouse Model

Rebecca K Sheean et al. JAMA Neurol. .

Abstract

Importance: Neuroinflammation appears to be a key modulator of disease progression in amyotrophic lateral sclerosis (ALS) and thereby a promising therapeutic target. The CD4+Foxp3+ regulatory T-cells (Tregs) infiltrating into the central nervous system suppress neuroinflammation and promote the activation of neuroprotective microglia in mouse models of ALS. To our knowledge, the therapeutic association of host Treg expansion with ALS progression has not been studied in vivo.

Objective: To assess the role of Tregs in regulating the pathophysiology of ALS in humans and the therapeutic outcome of increasing Treg activity in a mouse model of the disease.

Design, setting, and participants: This prospective multicenter human and animal study was performed in hospitals, outpatient clinics, and research institutes. Clinical and function assessment, as well as immunological studies, were undertaken in 33 patients with sporadic ALS, and results were compared with 38 healthy control participants who were consecutively recruited from the multidisciplinary ALS clinic at Westmead Hospital between February 1, 2013, and December 31, 2014. All data analysis on patients with ALS was undertaken between January 2015 and December 2016. Subsequently, we implemented a novel approach to amplify the endogenous Treg population using peripheral injections of interleukin 2/interleukin 2 monoclonal antibody complexes (IL-2c) in transgenic mice that expressed mutant superoxide dismutase 1 (SOD1), a gene associated with motor neuron degeneration.

Main outcomes and measures: In patients with ALS, Treg levels were determined and then correlated with disease progression. Circulating T-cell populations, motor neuron size, glial cell activation, and T-cell and microglial gene expression in spinal cords were determined in SOD1G93A mice, as well as the association of Treg amplification with disease onset and survival time in mice.

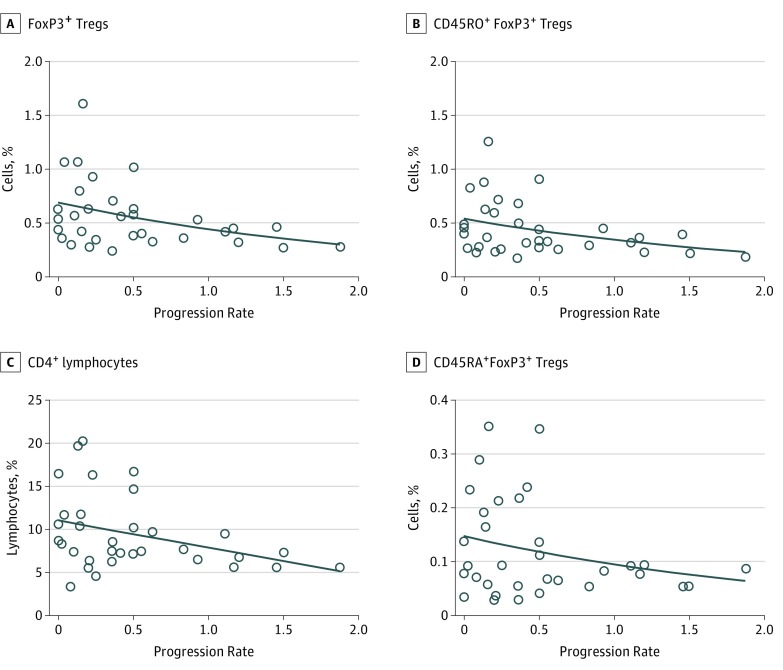
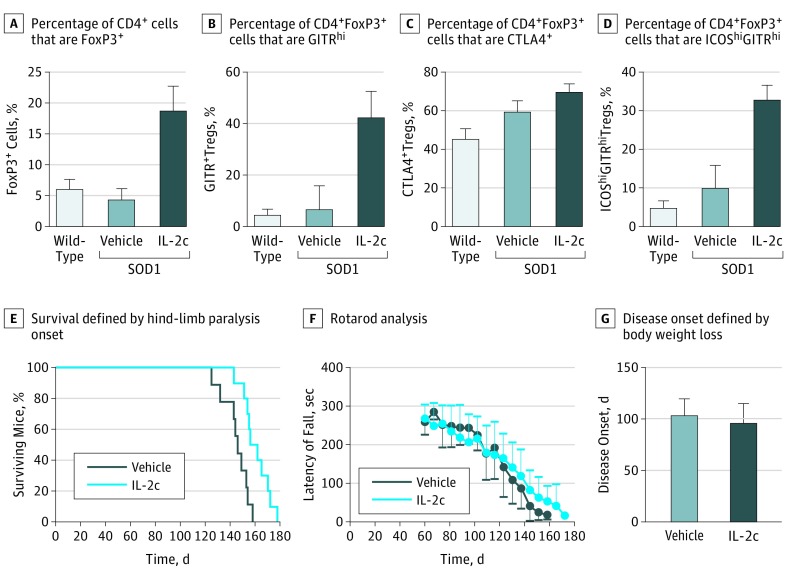
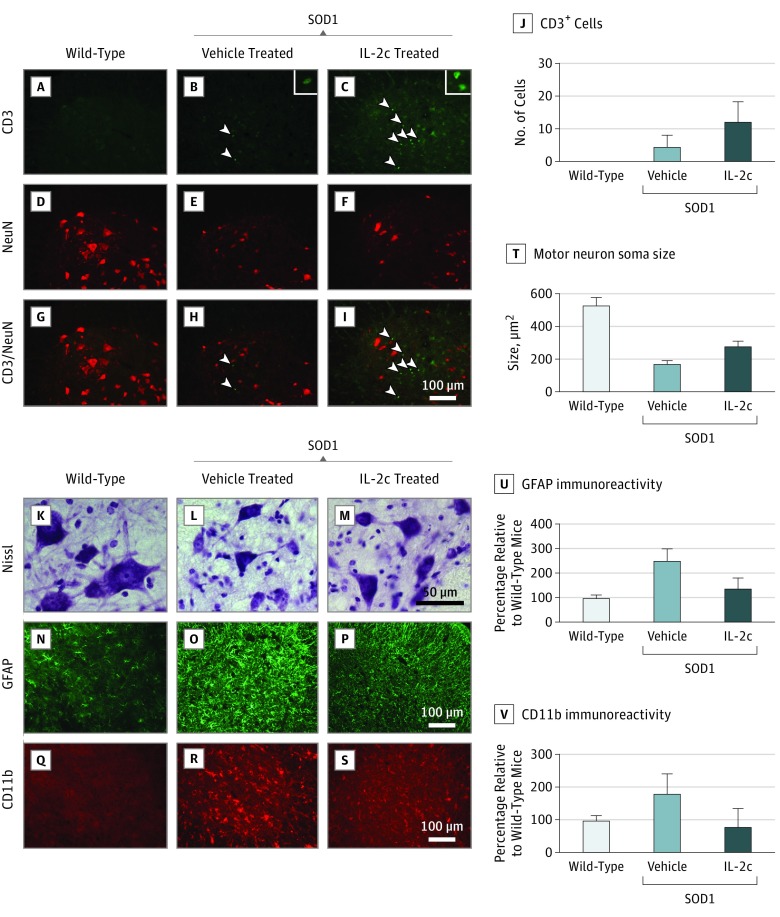
Results: The cohort of patients with ALS included 24 male patients and 9 female patients (mean [SD] age at assessment, 58.9 [10.9] years). There was an inverse correlation between total Treg levels (including the effector CD45RO+ subset) and rate of disease progression (R = -0.40, P = .002). Expansion of the effector Treg population in the SOD1G93A mice was associated with a significant slowing of disease progression, which was accompanied by an increase in survival time (IL-2c-treated mice: mean [SD], 160.6 [10.8] days; control mice: mean [SD], 144.9 [10.6] days; P = .003). Importantly, Treg expansion was associated with preserved motor neuron soma size and marked suppression of astrocytic and microglial immunoreactivity in the spinal cords of SOD1G93A mice, as well as elevated neurotrophic factor gene expression in spinal cord and peripheral nerves.

Conclusions and relevance: These findings establish a neuroprotective effect of Tregs, possibly mediated by suppression of toxic neuroinflammation in the central nervous system. Strategies aimed at enhancing the Treg population and neuroprotective activity from the periphery may prove therapeutically useful for patients with ALS.


Conflict of interest statement

Conflict of Interest Disclosures: Dr Kiernan serves as editor of the Journal of Neurology, Neurosurgery and Psychiatry. No other disclosures were reported.

Figures

Figure 1.
Figure 1.. Correlation of ALS Progression Rate With Peripheral Blood Regulatory T-Cells (Tregs)
A, Progression rate (change in Amyotrophic Lateral Sclerosis Functional Rating Scale score per month) was inversely correlated with frequency of total FoxP3+ Tregs, calculated as the sum of CD45RO+FoxP3+ Tregs (CD45RO+CD4+CD25hiCD127loFoxP3+) and CD45RA+FoxP3+ Tregs (CD45RA+CD4+CD25hiCD127loFoxP3+) in patients with ALS (n = 33; R = −0.41; P = .02). B, The frequency of CD45RO+FoxP3+ Tregs was inversely correlated with disease progression (R = −0.39; P = .02). C, The frequency of CD4+ was inversely correlated with disease progression (R = −0.36; P = .04). D, The presence of CD45RA+ Tregs was not correlated with disease progression (R = −0.20; P = .26). Frequencies were determined as a percentage of all leukocytes, and Pearson correlation was used on loge-transformed cell subsets.
Figure 2.
Figure 2.. Treatment With Interleukin 2c (IL-2c), Effector Regulatory T-Cell (Treg) Populations, and Disease Progression in SOD1G93A Mice
A-D, Fluorescence-activated cell sorting analysis of Treg cell populations in peripheral blood isolated from wild-type mice (n = 4), vehicle-treated SOD1G93A mice (n = 5), and IL-2c–treated SOD1G93A mice (n = 5) at 100 days of age. A, Differences were significant between vehicle-treated and IL-2c–treated SOD1G93A mice with respect to the percentage of CD4+ cells that are Foxp3+ (IL-2c–treated mice: mean [SD], 18.9% [3.8%] vs vehicle-treated mice: 4.4% [1.9%]; P < .001) and between IL-2c–treated SOD1G93A mice and age-matched wild-type mice (18.9% [3.8%] vs 6.2% [1.5%]. respectively; P < .001). B, Differences were significant between all groups in the percentage of CD4+Foxp3+ Tregs that are GITRhi (IL-2c–treated mice: 42.6% [9.7%] vs vehicle-treated mice: 6.9% [9.2%]; vs wild-type mice: 4.8% [2.1%]; P < .001). C, In the percentage of CD4+Foxp3+ Tregs that are CTLA4+, differences were significant between IL-2c–treated SOD1G93A mice (69.5% [9.6%]) and wild-type mice (45.0% [11.3%]; P = .03). D, In respect to the percentage of CD4+Foxp3+ Tregs that are ICOShiGITRhi, differences were significant between IL-2c–treated SOD1G93A mice (33.1% [8.0%]), vehicle-treated SOD1G93A mice (9.9% [13.4%]; P = .01), and wild-type mice (5.0% [3.3%]; P = .003).E, Survival of IL-2c–treated SOD1G93A mice (n = 10) was significantly prolonged compared with the vehicle-treated group (n = 9). Survival was defined by onset of hind-limb paralysis. Significance was determined using Kaplan-Meier survival analysis with the log-rank test. F, Rotarod performance. G, Disease onset as determined by the onset of weight loss was not affected by IL-2c treatment.
Figure 3.
Figure 3.. Interleukin 2c (IL-2c) Treatment, Infiltration of T-Cells, Motor Neurons, and Glial-Cell Immunoreactivity in Spinal Cords of SOD1G93A Mice
A-C, Representative micrographs of the ventral horns of lumbar spinal cords stained for CD3+ cells in wild-type mice, vehicle-treated SOD1G93A mice, and IL-2c–treated SOD1G93A mice; arrowheads indicate T-cells and insets show magnified T-cells. D-F, Representative micrographs of the ventral horns of lumbar spinal cords stained for NeuN in all 3 groups of mice. G-I, Micrographs stained for CD3+ cells and NeuN in disease end stages in wild-type mice, vehicle-treated SOD1G93A mice, and IL-2c–treated SOD1G93A mice. J, Quantification of CD3+ cells localized to the ventral horns of spinal cord sections (IL-2c–treated mice: mean [SD], 12.2 [6.1] cells; vehicle-treated mice: 4.4 [3.7] cells; P = .03). K-M, Representative micrographs of the ventral horns of lumbar spinal cords stained for Nissl in wild-type mice, vehicle-treated SOD1G93A mice, and IL-2c–treated SOD1G93A mice. N-P, Representative micrographs of the ventral horns of lumbar spinal cords stained for glial fibrillary acidic protein (GFAP) in all 3 groups of mice. Q-S, Representative micrographs of the ventral horns of lumbar spinal cords stained for CD11b at disease end stage in all 3 groups of mice. T, Quantification of motor neuron soma size from Nissl-stained spinal cord sections of IL-2c–treated SOD1G93A mice (mean [SD], 279.8 [28.6] μm2) compared with vehicle-treated mice (mean [SD], 167.4 [21.9] μm2; P = .001). U, Quantification of GFAP from spinal cord sections of IL-2c–treated SOD1G93A mice (mean [SD], 137.3% [43.0%]) compared with vehicle-treated mice (248.7% [49.7%]; P = .002). V, Quantification of cluster of differentiation molecule 11b (CD11b) immunoreactivity from spinal cord sections of SOD1G93A mice receiving IL-2c therapy (mean [SD], 79.8% [55.0%]) compared with vehicle-treated mice (179.4% [61.1%]; P = .02).

Comment in

References

    1. Engelhardt JI, Tajti J, Appel SH. Lymphocytic infiltrates in the spinal cord in amyotrophic lateral sclerosis. Arch Neurol. 1993;50(1):30-36. - PubMed
    1. Vucic S, Rothstein JD, Kiernan MC. Advances in treating amyotrophic lateral sclerosis: insights from pathophysiological studies. Trends Neurosci. 2014;37(8):433-442. - PubMed
    1. Appel SH, Beers DR, Henkel JS. T cell-microglial dialogue in Parkinson’s disease and amyotrophic lateral sclerosis: are we listening? Trends Immunol. 2010;31(1):7-17. - PMC - PubMed
    1. Beers DR, Zhao W, Wang J, et al. . ALS patients’ regulatory T lymphocytes are dysfunctional, and correlate with disease progression rate and severity. JCI Insight. 2017;2(5):e89530. - PMC - PubMed
    1. Boillée S, Yamanaka K, Lobsiger CS, et al. . Onset and progression in inherited ALS determined by motor neurons and microglia. Science. 2006;312(5778):1389-1392. - PubMed

Publication types