. 2018 Oct 1;315(4):E676-E693.
doi: 10.1152/ajpendo.00224.2017. Epub 2018 Mar 6.

Myeloid-specific deletion of Zfp36 protects against insulin resistance and fatty liver in diet-induced obese mice

Affiliations

Myeloid-specific deletion of Zfp36 protects against insulin resistance and fatty liver in diet-induced obese mice

Valentina Caracciolo et al. Am J Physiol Endocrinol Metab. .

Abstract

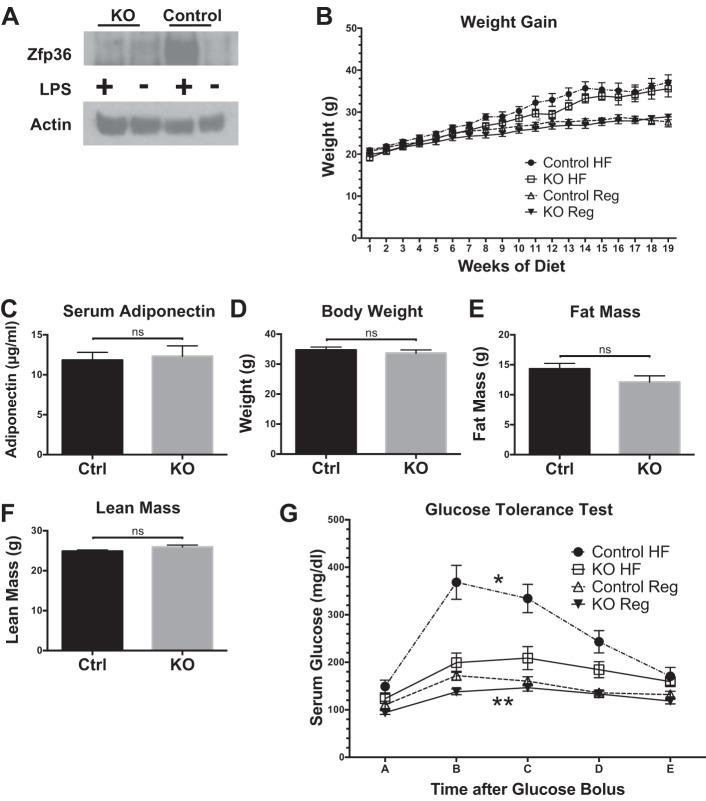
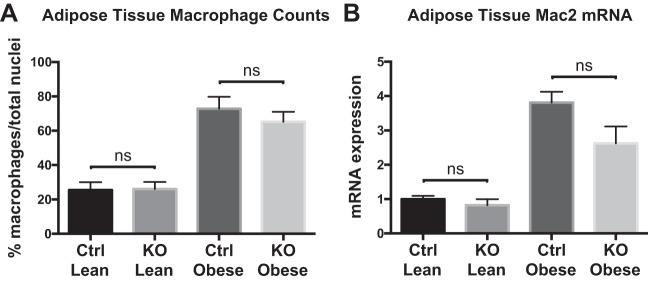
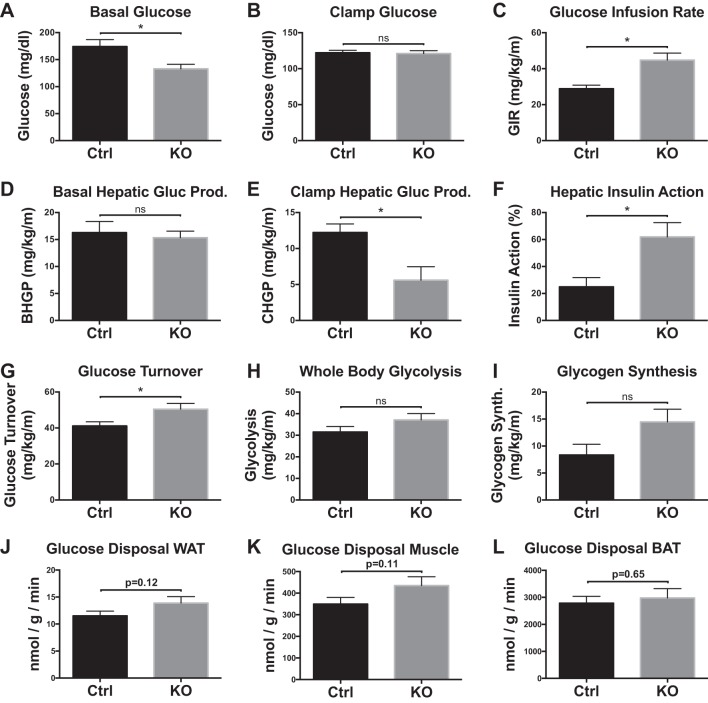
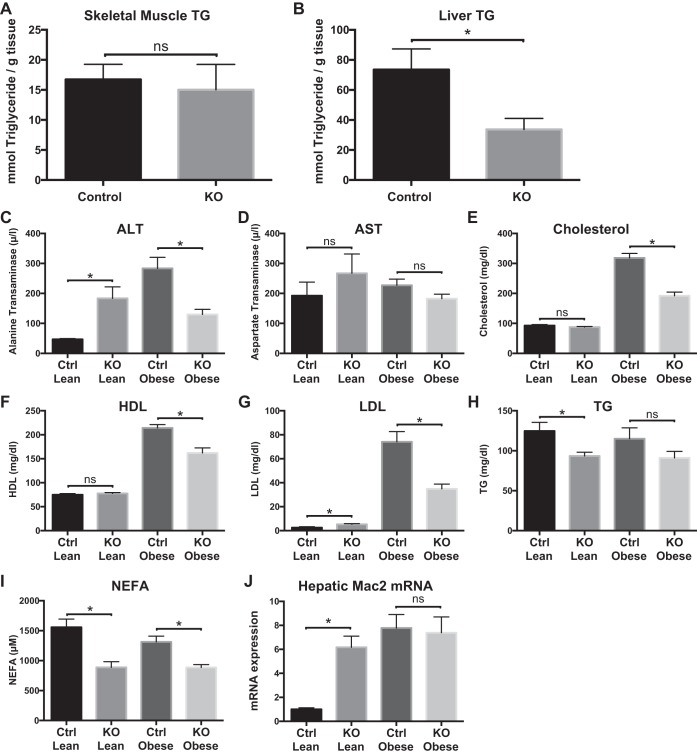
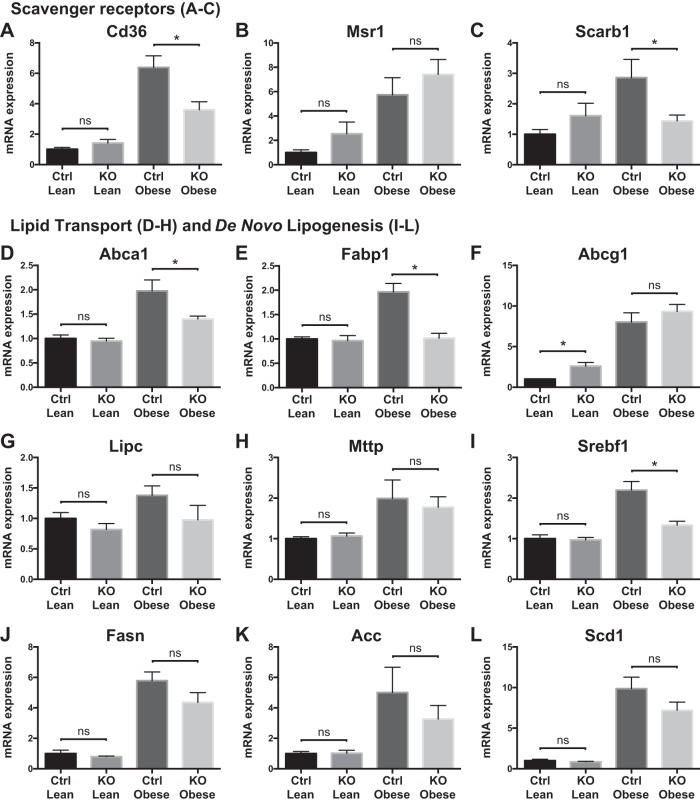
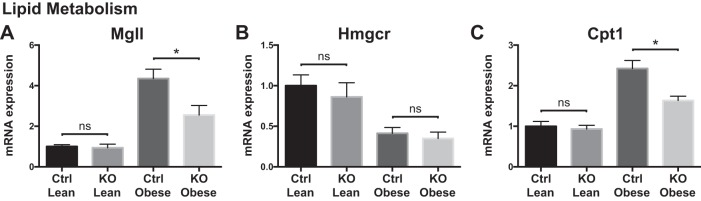
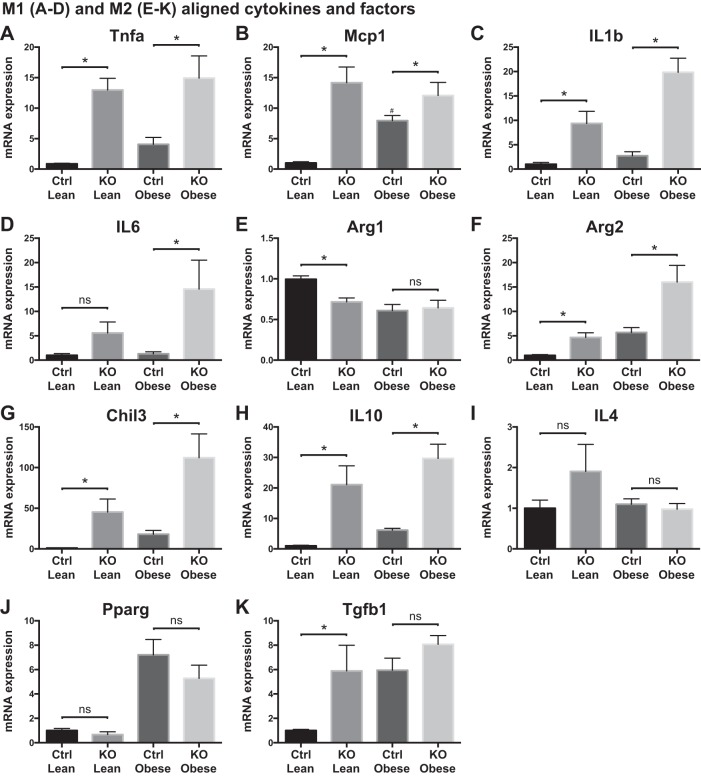
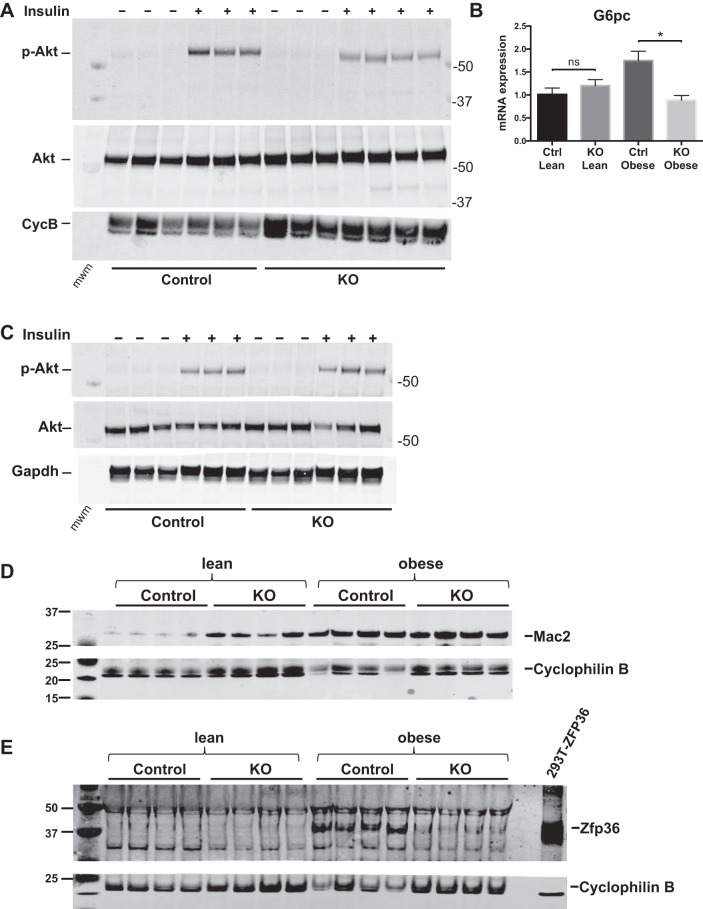
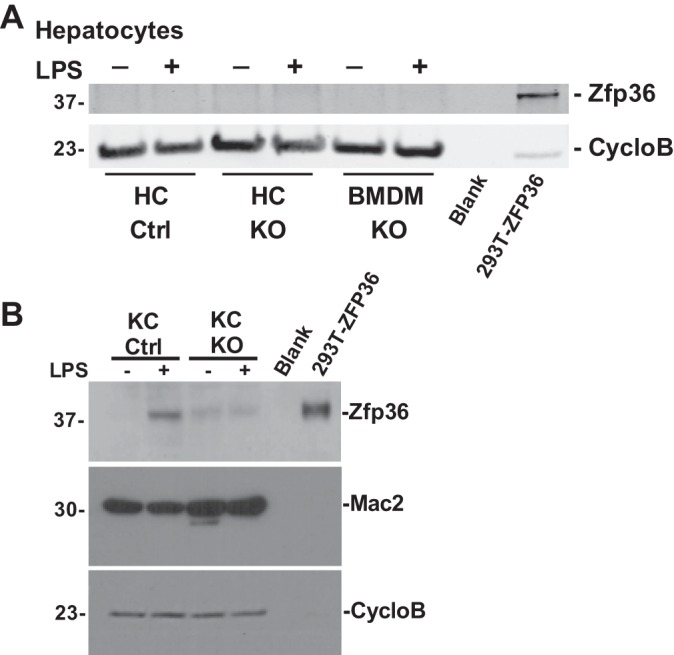
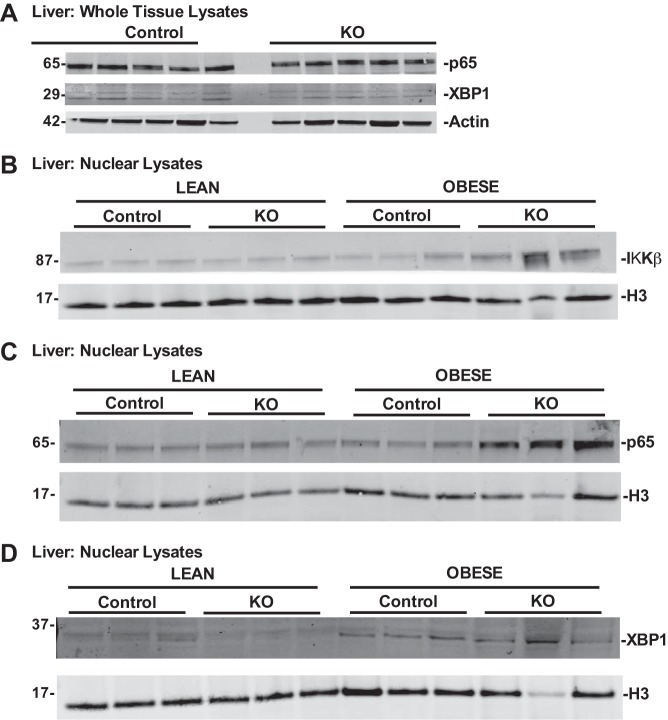
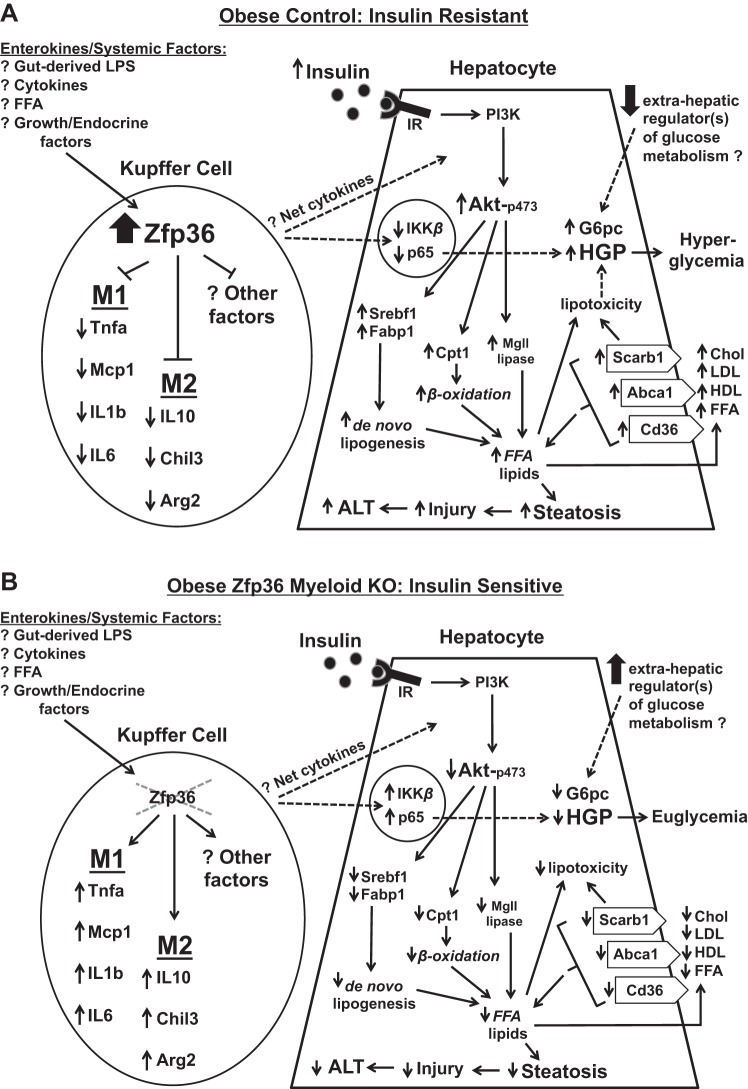
Obesity is associated with adipose tissue inflammation that contributes to insulin resistance. Zinc finger protein 36 (Zfp36) is an mRNA-binding protein that reduces inflammation by binding to cytokine transcripts and promoting their degradation. We hypothesized that myeloid-specific deficiency of Zfp36 would lead to increased adipose tissue inflammation and reduced insulin sensitivity in diet-induced obese mice. As expected, wild-type (Control) mice became obese and diabetic on a high-fat diet, and obese mice with myeloid-specific loss of Zfp36 [knockout (KO)] demonstrated increased adipose tissue and liver cytokine mRNA expression compared with Control mice. Unexpectedly, in glucose tolerance testing and hyperinsulinemic-euglycemic clamp studies, myeloid Zfp36 KO mice demonstrated improved insulin sensitivity compared with Control mice. Obese KO and Control mice had similar macrophage infiltration of the adipose depots and similar peripheral cytokine levels, but lean and obese KO mice demonstrated increased Kupffer cell (KC; the hepatic macrophage)-expressed Mac2 compared with lean Control mice. Insulin resistance in obese Control mice was associated with enhanced Zfp36 expression in KCs. Compared with Control mice, KO mice demonstrated increased hepatic mRNA expression of a multitude of classical (M1) inflammatory cytokines/chemokines, and this M1-inflammatory hepatic milieu was associated with enhanced nuclear localization of IKKβ and the p65 subunit of NF-κB. Our data confirm the important role of innate immune cells in regulating hepatic insulin sensitivity and lipid metabolism, challenge-prevailing models in which M1 inflammatory responses predict insulin resistance, and indicate that myeloid-expressed Zfp36 modulates the response to insulin in mice.

Keywords: Zfp36; diabetes; inflammation; insulin; liver; obesity.


Figures

Fig. 1.
Fig. 1.
Primary macrophage-expressed zinc finger protein 36 (Zfp36), growth curves, serum adiponectin concentrations, body composition, and glucose tolerance testing in lean and obese loxP-flanked Zfp36 C57BL/6 (Zfp36fl/fl; Control) and Zfp36fl/fl;LysMCre [myeloid knockout (KO)] mice. A: Zfp36 protein expression in bone marrow-derived macrophages from Zfp36 fl/fl;LysMCre (myeloid KO) and Zfp36fl/fl (Control) mice, with and without endotoxin/LPS treatment (1 μg·ml−1·3 h−1). The loading control is actin. This blot is representative of an experiment performed 3 times. B: growth curves of Control and KO mice on regular mouse chow (Reg) and high-fat (HF) diets (n = 6–9 mice/group, mean values with SE). C: serum adiponectin levels in the obese Control (Ctrl) and KO mice after a 4-mo HF diet were similar (n = 8 mice/group). D–F: body composition of Control and KO mice after a 4-mo HF diet indicates equivalent body weight, fat mass, and lean mass in each group (n = 9–10 mice/group), respectively. ns, nonsignificant difference comparing genotypes on the HF diet. G: glucose tolerance testing of Control and KO mice after 4 mo on the regular or HF diets indicates improved glucose tolerance in the obese KO mice [n = 8–11 mice/group, mean values with SE; *P < 0.05 comparing areas under the curve (AUCs) of obese mice; **P < 0.05 comparing AUCs of lean mice].
Fig. 2.
Fig. 2.
Adipose tissue macrophage counts and Mac2 mRNA expression in lean and obese loxP-flanked zinc finger protein 36 (Zfp36) C57BL/6 [Zfp36fl/fl; Control (Ctrl)] and Zfp36fl/fl;LysMCre [myeloid knockout (KO)] mice. A: Mac2-positive cells were assessed in representative tissue sections from 4 mice per study group, as described in MATERIALS AND METHODS. Macrophage cell counts were normalized to total nuclei per histologic section. B: quantitative RT-PCR of Mac2 mRNA expression in gonadal fat from lean and obese Control and KO mice (n = 6–8 mice/group; both figures: mean values with SE). ns, nonsignificant difference.
Fig. 3.
Fig. 3.
Insulin action assessed in vivo during 2 h hyperinsulinemic-euglycemic clamp studies in awake loxP-flanked zinc finger protein 36 (Zfp36) C57BL/6 [Zfp36fl/fl; Control (Ctrl)] and Zfp36fl/fl;LysMCre [myeloid knockout (KO)] mice after 4 mo of a high-fat diet. A: basal glucose levels. B: steady-state clamp glucose. C: steady-state glucose infusion rates (GIR) during clamps. D and E: hepatic glucose production (HGP) in the basal state (BHGP) and during the insulin-stimulated state [clamp HGP (CHGP)]. F: hepatic insulin action expressed as insulin-mediated percent suppression of basal HGP. G–I: insulin-stimulated whole-body glucose turnover, glycolysis, and glycogen synthesis during the 2-h hyperinsulinemic-euglycemic clamp, respectively. J–L: insulin-stimulated glucose uptake tended to be higher in white adipose tissue (WAT; epididymal; J), skeletal muscle (gastrocnemius; K), but not brown adipose tissue (BAT; interscapular; L) in the obese Zfp36 KO mice compared with Control mice but did not reach statistical significance (n = 9–10 mice/group, mean values with SE; *P < 0.05). ns, nonsignificant difference.
Fig. 4.
Fig. 4.
Tissue triglycerides (TG), serologic studies, and hepatic Mac2 mRNA expression in loxP-flanked zinc finger protein 36 (Zfp36) C57BL/6 [Zfp36fl/fl; Control (Ctrl)] and Zfp36fl/fl;LysMCre [myeloid knockout (KO)] lean and obese mice. A: skeletal muscle TGs (n = 9–10/group), B: liver TG (n = 9–10/group), C–I: alanine transaminase (ALT), aspartate transaminase (AST), serum cholesterol, serum HDL, serum LDL, serum TG, and serum nonesterified fatty acids (NEFA; n = 9 mice/group, mean values with SE), respectively. J: liver mRNA expression of Mac2 in lean and obese Control and myeloid-Zfp36 KO mice (n = 11–15 mice/group; *P < 0.05). ns, nonsignificant difference.
Fig. 5.
Fig. 5.
Liver scavenger receptors, lipid transport, and lipogenic mRNA expression in loxP-flanked zinc finger protein 36 (Zfp36) C57BL/6 [Zfp36fl/fl; Control (Ctrl)] and Zfp36fl/fl;LysMCre [myeloid knockout (KO)] lean and obese mice. A–C: scavenger receptors: cluster of differentiation 36 (Cd36), macrophage scavenger receptor 1 (Msr1), and scavenger receptor class B member 1 (Scarb1), respectively. D–H: lipid transport transcripts: ATP-binding cassette subfamily A member 1 (Abca1), fatty acid-binding protein 1 (Fabp1), ATP-binding cassette subfamily G member 1 (Abcg1), hepatic type lipase C (Lipc), and microsomal triglyceride transfer protein (Mttp; n = 6–12 mice/group, mean values with SE; *P < 0.05). I–L: factors involved in de novo lipogenesis; sterol regulatory element binding transcription factor 1 (Srepf1), fatty acid synthase (Fasn), Acetyl-CoA carboxylase (Acc), stearoyl-Coenzyme A desaturase 1 (Scd1). ns, nonsignificant difference.
Fig. 6.
Fig. 6.
Liver mRNA expression of lipid metabolism genes in loxP-flanked zinc finger protein 36 (Zfp36) C57BL/6 [Zfp36fl/fl; Control (Ctrl)] and Zfp36fl/fl;LysMCre [myeloid knockout (KO)] lean and obese mice. A–C: enzymes involved in lipid metabolism: monoacylglycerol lipase [macrophage galactose-type lectin 1 (Mgll)], 3-hydroxy-3-methyl-glutaryl-CoA reductase (Hmgcr), and carnitine palmitoyltransferase 1 (Cpt1; n = 6–12 mice/group, mean values with SE; *P < 0.05). ns, nonsignificant difference.
Fig. 7.
Fig. 7.
Liver cytokine mRNA expression in loxP-flanked zinc finger protein 36 (Zfp36) C57BL/6 [Zfp36fl/fl; Control (Ctrl)] and Zfp36fl/fl;LysMCre [myeloid knockout (KO)] lean and obese mice. A–D: classically (M1) aligned factors: Tnfa, monocyte chemoattractant protein-1 (Mcp1), IL-1b, IL-6. E–K: alternatively (M2) aligned factors: arginase-1 (Arg1), arginase-2 (Arg2), Chitinase-like 3 (Chil3), IL-10, IL-4, peroxisome proliferator-activated receptor-γ (Pparg), transforming growth factor-β (Tgfb1; n = 6–12 mice/group, mean values with SE; *P < 0.05). ns, nonsignificant difference.
Fig. 8.
Fig. 8.
Insulin-stimulated phosphorylation of Akt (pAkt) in liver and skeletal muscle of loxP-flanked zinc finger protein 36 (Zfp36) C57BL/6 [Zfp36fl/fl; Control (Ctrl)] and Zfp36fl/fl;LysMCre [myeloid knockout (KO)] mice on the high-fat diet. A: obese mice were treated with vehicle control or insulin (10 U/kg), and livers were processed for Western blots of total Akt or pAkt-Ser473. Cyclophilin B (CycB) serves as loading control. B: insulin sensitivity, as assessed by glucose-6-phosphatase (G6pc) mRNA expression in mouse livers (n = 17–22 mice/group, mean values with SE; *P < 0.05). C: total and pAkt measured in skeletal muscle from vehicle or insulin-treated mice, with GAPDH as a loading control. Western blots of liver lysates from Control and myeloid KO mice, both lean and obese. D: Mac2 expression with Cyclophilin B as loading control. E: Zfp36 expression with Cyclophilin B as loading control. mwm, molecular weight marker; ns, nonsignificant difference.
Fig. 9.
Fig. 9.
Kupffer cells (KCs), but not hepatocytes, express zinc finger protein 36 (Zfp36). A: vehicle and LPS-stimulated primary hepatocytes and bone marrow-derived macrophages (BMDM) isolated from loxP-flanked Zfp36 C57BL/6 [Zfp36fl/fl; Control (Ctrl)] and Zfp36fl/fl;LysMCre [myeloid knockout (KO)] mice were tested for Zfp36 protein expression by Western blotting using Cyclophilin B (CycloB) as loading control (compare with Fig. 1A). Positive control lane was 5 μg of cell lysate from 293T cells engineered to overexpress human ZFP36 cDNA. B: primary KCs express Zfp36 in response to LPS stimulation. Vehicle and LPS-stimulated primary KCs were tested for Zfp36 expression by Western blotting, as well as for Mac2 and Cyclophilin B expression (loading control). Positive control lane was 5 μg of cell lysate from 293T cells engineered to overexpress human ZFP36 cDNA. Data are representative of experiments performed 3 times.
Fig. 10.
Fig. 10.
Loss of Kupffer cell-expressed zinc finger protein 36 (Zfp36) in obese mice is associated with enhanced hepatic IKKβ and p65 but not X-box-binding protein 1 (XBP1) nuclear activation. Whole liver lysates and liver nuclear extracts were isolated from lean and obese loxP-flanked Zfp36 C57BL/6 (Zfp36fl/fl; Control) and Zfp36fl/fl;LysMCre [myeloid knockout (KO)] mice and tested for protein expression. A: whole liver lysates from obese Control and KO mice demonstrate similar p65 and Xbp1 protein expression (with actin-loading control). B: nuclear lysates from obese KO mice have enhanced levels of IKKβ compared with obese Control mice or lean mice of both genotypes (H3 loading control). C: nuclear lysates from obese KO mice have enhanced levels of p65 compared with obese Control mice or lean mice of both genotypes (H3 loading control). D: hepatic nuclear Xbp1 expression is similar in obese Control and KO mice and higher than that observed in lean mice of both genotypes (H3 loading control). Data are representative of experiments performed 3 times.
Fig. 11.
Fig. 11.
Model summarizing the effects of Kupffer-expressed zinc finger protein 36 (Zfp36) on the hepatic response to insulin in obese mice. Dotted lines indicate potential effects that remain to be fully explored. A: in obese Control (Zfp36fl/fl) mice, Zfp36 expression is upregulated in Kupffer cells (KC), leading to reduced expression of classically activated and alternatively activated (M1 and M2, respectively) cytokines. The factors that stimulate Zfp36 expression in the KCs of obese mice remain to be determined, but candidates include gut-derived endotoxin (LPS), as well as systemic or local lipids, cytokines, or growth factors that are perturbed in obese mice. The net effect of enhanced Zfp36 expression in KCs is to provoke insulin resistance in hepatocytes: this is demonstrated by the well-documented preservation of the lipid-promoting effects of insulin coupled with the impaired ability of insulin to regulate hepatic glucose production (HGP). The insulin-resistant mice experience hyperlipidemia, hepatic triglyceride (TG) accumulation/steatosis, and hyperglycemia. Extrahepatic factors responsible for modulating glucose metabolism in the livers of insulin-resistant mice may be impaired, although specific factors remain to be fully established (62). B: in obese, conditional Zfp36fl/fl;LysMCre [myeloid knockout (KO)] mice, loss of KC-expressed Zfp36 leads to enhanced expression of M1 and M2 cytokines. The net effects of these factors are to enhance insulin sensitivity in the livers of the KO mice; this is demonstrated by reduced lipid production and improved glucose tolerance in the KO mice. Improved insulin sensitivity in the KO mice leads to reduced hyperlipidemia, reduced hepatic TG accumulation/steatosis, and euglycemia. The improvement in insulin sensitivity is associated with enhanced activation of p65 in the livers of the KO mice, a feature recently described to contribute to the insulin response in the liver (32). FFA, free fatty acid; Mcp1, monocyte chemoattractant protein-1; Chil3, Chitinase-like 3; Arg2, arginase-2; IR, insulin receptor; PI3K, phosphatidylinositol 3-kinase; G6pc, glucose-6-phosphatase; Srebf1, sterol response element-binding factor 1; Fabp1, fatty acid-binding protein 1; Cpt1, carnitine palmitoyltransferase 1; Mgl1, macrophage galactose-type lectin 1; Scarb1, scavenger receptor class B member 1; Abca1, ATP-binding cassette subfamily A member 1; Cd36, cluster of differentiation 36; Chol, cholesterol; ALT, alanine transaminase.

References

    1. Arkan MC, Hevener AL, Greten FR, Maeda S, Li ZW, Long JM, Wynshaw-Boris A, Poli G, Olefsky J, Karin M. IKK-beta links inflammation to obesity-induced insulin resistance. Nat Med 11: 191–198, 2005. doi:10.1038/nm1185. - DOI - PubMed
    1. Awazawa M, Ueki K, Inabe K, Yamauchi T, Kubota N, Kaneko K, Kobayashi M, Iwane A, Sasako T, Okazaki Y, Ohsugi M, Takamoto I, Yamashita S, Asahara H, Akira S, Kasuga M, Kadowaki T. Adiponectin enhances insulin sensitivity by increasing hepatic IRS-2 expression via a macrophage-derived IL-6-dependent pathway. Cell Metab 13: 401–412, 2011. doi:10.1016/j.cmet.2011.02.010. - DOI - PubMed
    1. Blackshear PJ. Tristetraprolin and other CCCH tandem zinc-finger proteins in the regulation of mRNA turnover. Biochem Soc Trans 30: 945–952, 2002. doi:10.1042/bst0300945. - DOI - PubMed
    1. Boden G. Obesity and free fatty acids. Endocrinol Metab Clin North Am 37: 635–646, 2008. doi:10.1016/j.ecl.2008.06.007. - DOI - PMC - PubMed
    1. Bruun JM, Lihn AS, Pedersen SB, Richelsen B. Monocyte chemoattractant protein-1 release is higher in visceral than subcutaneous human adipose tissue (AT): implication of macrophages resident in the AT. J Clin Endocrinol Metab 90: 2282–2289, 2005. doi:10.1210/jc.2004-1696. - DOI - PubMed

Publication types

MeSH terms