Clinical Trial
. 2018 May 1;128(5):2116-2126.
doi: 10.1172/JCI97992. Epub 2018 Apr 16.

A PET imaging agent for evaluating PARP-1 expression in ovarian cancer

Affiliations
Clinical Trial

A PET imaging agent for evaluating PARP-1 expression in ovarian cancer

Mehran Makvandi et al. J Clin Invest. .

Abstract

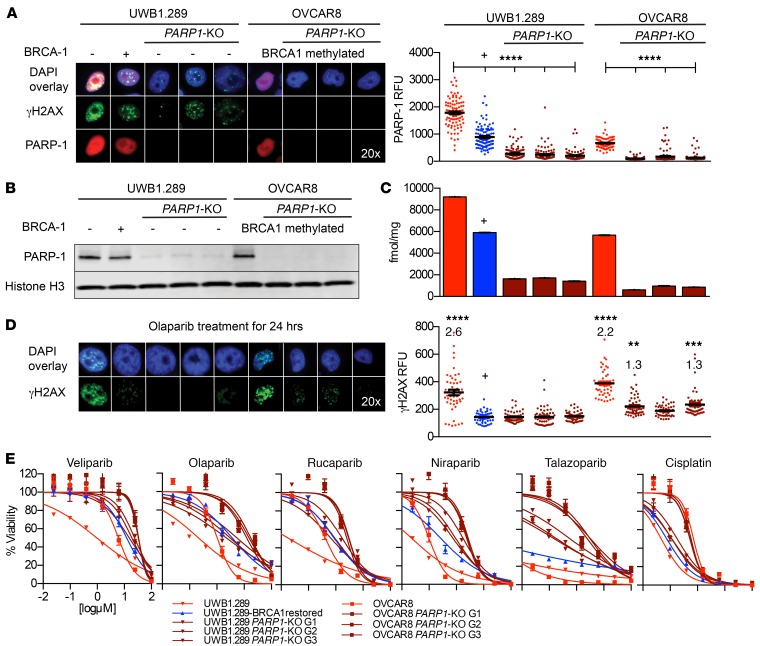
Background: Poly(ADP-ribose) polymerase (PARP) inhibitors are effective in a broad population of patients with ovarian cancer; however, resistance caused by low enzyme expression of the drug target PARP-1 remains to be clinically evaluated in this context. We hypothesize that PARP-1 expression is variable in ovarian cancer and can be quantified in primary and metastatic disease using a novel PET imaging agent.

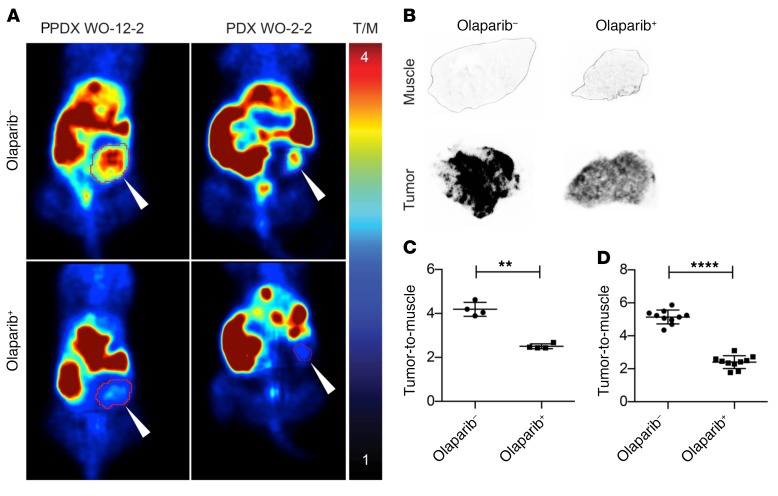
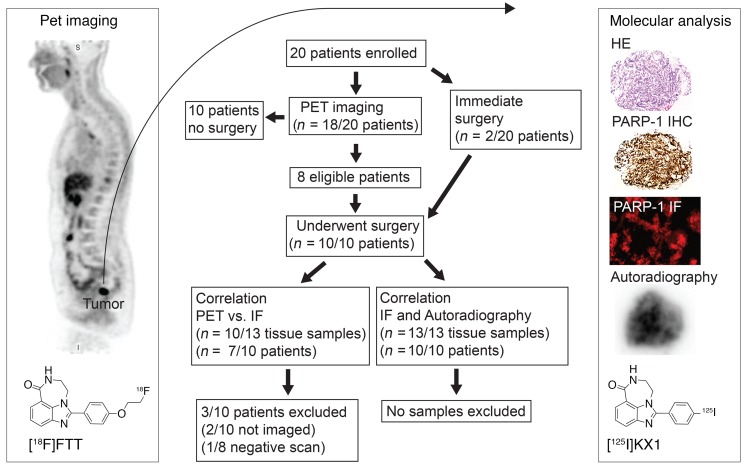
Methods: We used a translational approach to describe the significance of PET imaging of PARP-1 in ovarian cancer. First, we produced PARP1-KO ovarian cancer cell lines using CRISPR/Cas9 gene editing to test the loss of PARP-1 as a resistance mechanism to all clinically used PARP inhibitors. Next, we performed preclinical microPET imaging studies using ovarian cancer patient-derived xenografts in mouse models. Finally, in a phase I PET imaging clinical trial we explored PET imaging as a regional marker of PARP-1 expression in primary and metastatic disease through correlative tissue histology.

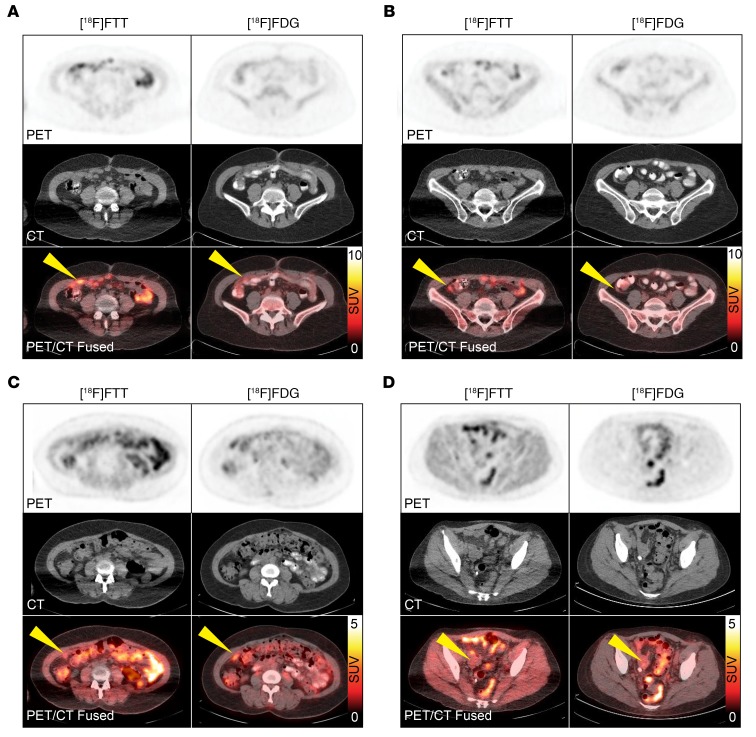
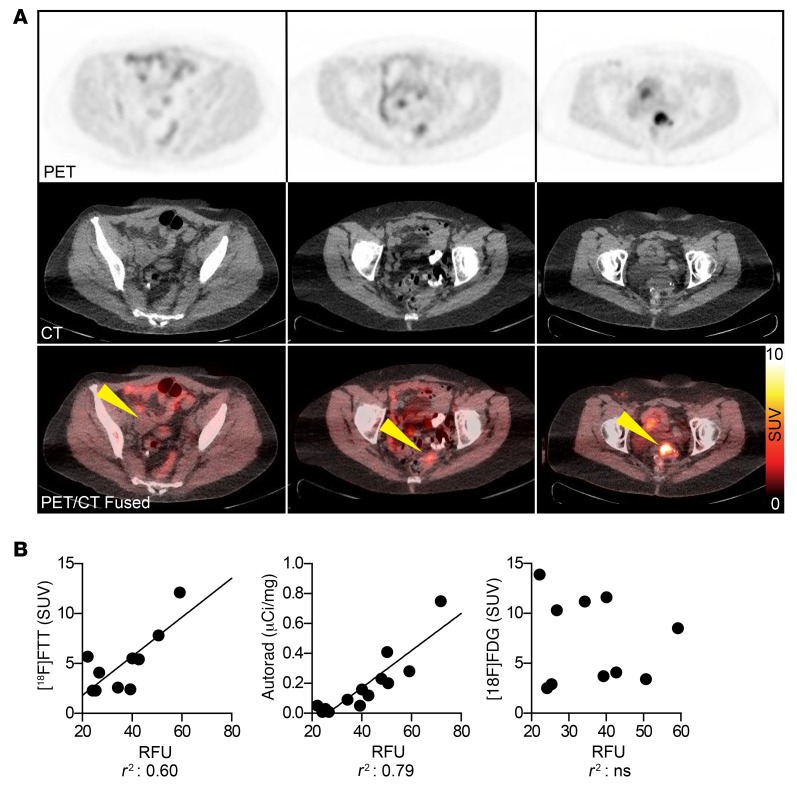
Results: We found that deletion of PARP1 causes resistance to all PARP inhibitors in vitro, and microPET imaging provides proof of concept as an approach to quantify PARP-1 in vivo. Clinically, we observed a spectrum of standard uptake values (SUVs) ranging from 2-12 for PARP-1 in tumors. In addition, we found a positive correlation between PET SUVs and fluorescent immunohistochemistry for PARP-1 (r2 = 0.60).

Conclusion: This work confirms the translational potential of a PARP-1 PET imaging agent and supports future clinical trials to test PARP-1 expression as a method to stratify patients for PARP inhibitor therapy.

Trial registration: Clinicaltrials.gov NCT02637934.

Funding: Research reported in this publication was supported by the Department of Defense OC160269, a Basser Center team science grant, NIH National Cancer Institute R01CA174904, a Department of Energy training grant DE-SC0012476, Abramson Cancer Center Radiation Oncology pilot grants, the Marsha Rivkin Foundation, Kaleidoscope of Hope Foundation, and Paul Calabresi K12 Career Development Award 5K12CA076931.

Keywords: Diagnostic imaging; Molecular biology; Oncology; Pharmacology; Therapeutics.


Conflict of interest statement

Conflict of interest: The authors have declared that no conflict of interest exists.

Figures

Figure 1
Figure 1. The characterization of PARP1-KO ovarian cancer cell lines and in vitro evaluation of PARP inhibitor efficacy.
(A) Immunofluorescence showed PARP-1 was absent in more than 90% of single cells in PARP1-KO polyclonal populations (ANOVA, ****P < 0.0001) and was reduced in BRCA1-restored cells compared with parent control (ANOVA, ****P < 0.0001). (B) Polyclonal populations of PARP1-KO cell lines had reduced PARP-1 by Western blot compared with parent control. (C) [125I]KX1 radioligand binding assays showed a significant reduction in radiotracer binding in PARP1-KO and UWB1.289 BRCA1-restored cell lines compared with parent control (ANOVA, P < 0.0001). (D) Immunofluorescence of olaparib-treated UWB1.289 PARP1-KO and UWB1.289 BRCA1-restored cells showed no increase in γH2AX compared with DMSO controls. Olaparib-treated OVCAR8 PARP1-KO G1 and G3 cells showed a 1.3 times increase (ANOVA, **P < 0.01 and ***P < 0.001, respectively) in γH2AX from DMSO controls. This was in contrast to olaparib-treated UWB1.289 and OVCAR8 cells that showed a 2.6 times (ANOVA, ****P < 0.0001) and 2.2 times (ANOVA, ****P < 0.0001) increase in γH2AX from DMSO controls. (E) Cell viability assays showed that PARP1-KO cells were equally resistant to olaparib compared with BRCA1-restored cells and all clinical PARP inhibitors required PARP-1 for maximum efficacy. Loss of PARP1 caused the greatest change in efficacy for niraparib and talazoparib. Cisplatin sensitivity was used as a positive control and remained unchanged after loss of PARP1. All in vitro experiments were completed 3 independent times. Cell lines shown in AD, from left to right, are: UWB1.289, UWB1.289 BRCA1 restored, UWB1.289 PARP1-KO G1, UWB1.289 PARP1-KO G2, UWB1.289 PARP1-KO G3, OVCAR8, OVCAR8 PARP1-KO G1, OVCAR8 PARP1-KO G2, and OVCAR8 PARP1-KO G3. –, BRCA1 mutant. +, BRCA1 restored.
Figure 2
Figure 2. In vivo [18F]FTT microPET imaging and ex vivo autoradiography of 2 xenografts derived from patients with ovarian cancer.
(A) Tumor-bearing mice underwent microPET imaging with [18F]FTT before (top images) and after (bottom images) olaparib treatment. White arrows point to patient-derived xenograft tumors. (B) Ex vivo autoradiographs of tumor and muscle from untreated (–) versus olaparib-treated (+) mice. (C) Significant differences were observed in the tumor-to-muscle ratios calculated before and after olaparib treatment from microPET images (4.2 ± 0.32 vs. 2.5 ± 0.11, parametric paired t test, **P < 0.0025, n = 4). (D) Ex vivo autoradiographs of untreated (–) versus olaparib-treated (+) mice shown in B also showed a statistically significant difference between groups (5.14 ± 0.13 vs. 2.41 ± 0.18, n = 2, 10 sections/tumor, parametric unpaired t test, ****P < 0.0001).
Figure 3
Figure 3. Diagram overview and flow chart of the pilot clinical trial of [18F]FTT PET/CT imaging in ovarian cancer.
Ten patients who were enrolled and underwent PET imaging were excluded from this subanalysis due to lack of clinical tissue samples available for correlative studies.
Figure 4
Figure 4. Immunohistochemistry and autoradiography analysis on clinical tissue.
Distance bars represent 275 μM. (A) HE, PARP-1, and [125I]KX-1 autoradiograph on adjacent tissue sections showed colocalization between [125I]KX1 and PARP-1 c-IHC. (B) In vitro autoradiography showed a difference in PARP-1 expression that was also confirmed by PARP-1 f-IHC. Max intensity by autoradiograph was 0.28 vs. 0.20 μCi/mg and fluorescent intensity of PARP-1 from whole-section f-IHC was 9.6 vs. 6.7 RFU.
Figure 5
Figure 5. Clinical [18F]FTT and [18F]FDG PET/CT images of a patient with ovarian cancer with vaginal cuff lesion.
Minimal radiotracer in the urinary bladder with [18F]FTT PET allowed for clear visualization of the lesion (green arrow) with no interference, despite some bowel uptake (yellow arrow on [18F]FTT image). Note excreted radiotracer in the bladder on [18F]FDG PET (yellow arrow on [18F]FDG PET).
Figure 6
Figure 6. Patients 2 and 11 underwent [18F]FTT PET/CT imaging within 2 weeks of completing 4 cycles of carboplatin and paclitaxel.
Omental metastases in patient 2 showed higher uptake of [18F]FTT than [18F]FDG with maximum SUVs of (A) 7.8 vs. 3.4 and (B) 5.1 vs. 2.0. Patient 2 was platinum resistant and relapsed within 4 months of therapy. Patient 11 showed low uptake on both [18F]FTT and [18F]FDG with maximum SUVs of (C) 2.4 vs. 3.7 and (D) 2.3 vs. 2.9. Patient 11 received 2 additional cycles of chemotherapy and was platinum sensitive. Yellow arrows indicate sites of disease.
Figure 7
Figure 7. [18F]FTT PET imaging of PARP-1 in ovarian cancer patients and tissue correlates.
(A) The spectrum of PARP-1 expression as determined by [18F]FTT PET/CT imaging with maximum SUVs ranging from approximately 2 to 12. Yellow arrows indicate sites of disease. (B) We found a positive correlation between PARP-1 immunofluorescence versus [18F]FTT PET or [125I]KX1 autoradiography (linear regression, r2 = 0.60, 0.79). No associations were observed between PARP-1 immunofluorescence, [18F]FTT imaging, or [125I]KX1 autoradiography and [18F]FDG.

Comment in

References

    1. Siegel RL, Miller KD, Jemal A. Cancer statistics, 2016. CA Cancer J Clin. 2016;66(1):7–30. doi: 10.3322/caac.21332. - DOI - PubMed
    1. Herzog TJ. The current treatment of recurrent ovarian cancer. Curr Oncol Rep. 2006;8(6):448–454. doi: 10.1007/s11912-006-0074-9. - DOI - PubMed
    1. Lord CJ, Ashworth A. PARP inhibitors: synthetic lethality in the clinic. Science. 2017;355(6330):1152–1158. doi: 10.1126/science.aam7344. - DOI - PMC - PubMed
    1. Konstantinopoulos PA, Ceccaldi R, Shapiro GI, D’Andrea AD. Homologous recombination deficiency: exploiting the fundamental vulnerability of ovarian cancer. Cancer Discov. 2015;5(11):1137–1154. doi: 10.1158/2159-8290.CD-15-0714. - DOI - PMC - PubMed
    1. Mirza MR, Matulonis UA. Niraparib in recurrent ovarian cancer. N Engl J Med. 2017;376(8):801–802. doi: 10.1056/NEJMc1616633. - DOI - PubMed

Publication types

MeSH terms

Associated data