

Selection of suitable reference genes for normalization of quantitative RT-PCR (RT-qPCR) expression data across twelve tissues of riverine buffaloes (Bubalus bubalis)
- PMID: 29509770
- PMCID: PMC5839537
- DOI: 10.1371/journal.pone.0191558
Selection of suitable reference genes for normalization of quantitative RT-PCR (RT-qPCR) expression data across twelve tissues of riverine buffaloes (Bubalus bubalis)
Abstract
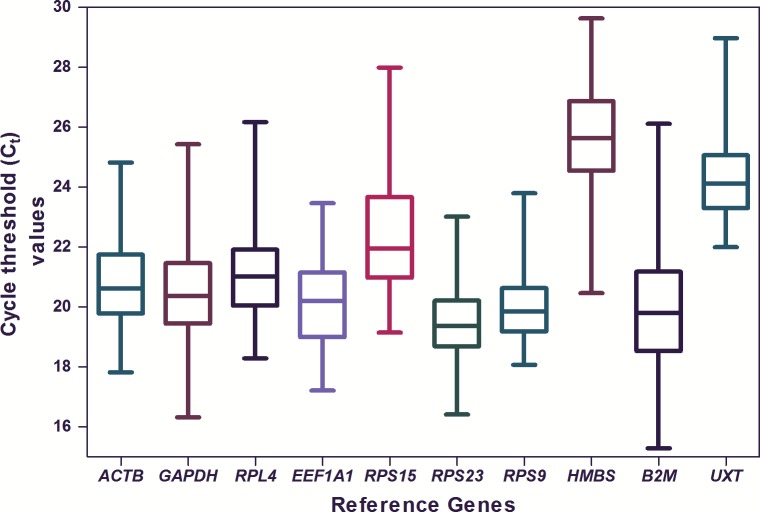
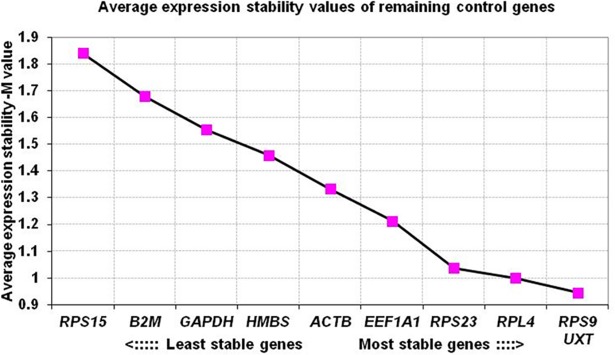
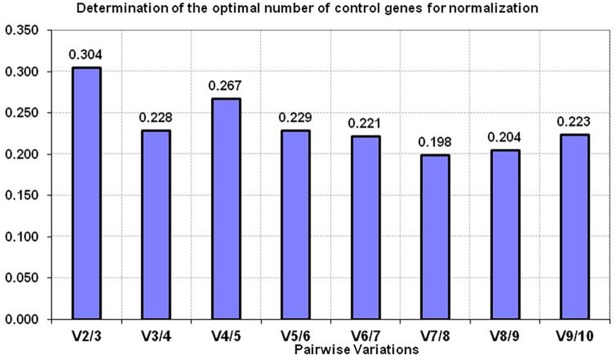
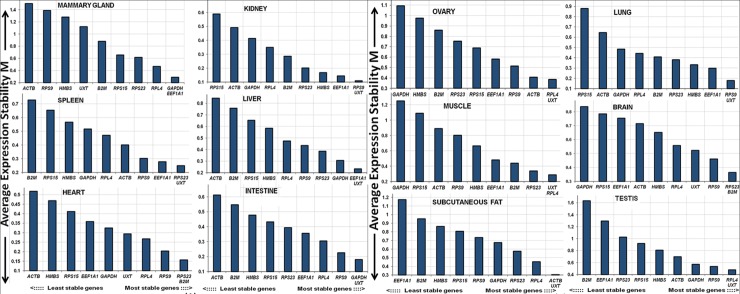
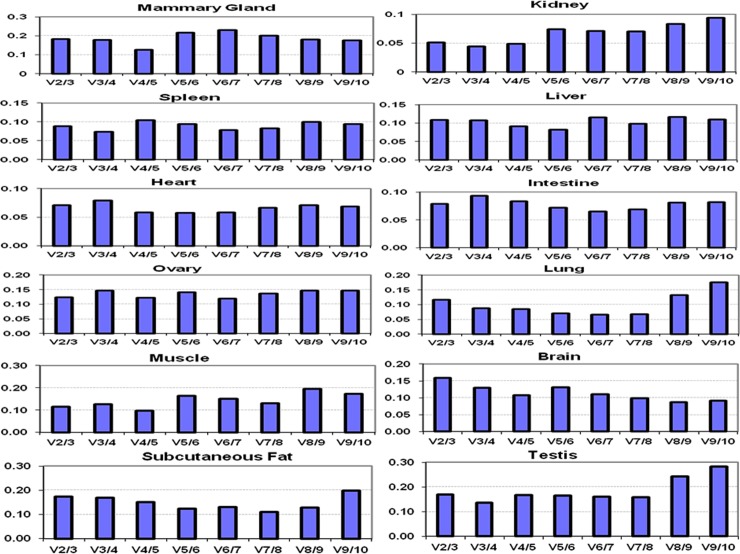
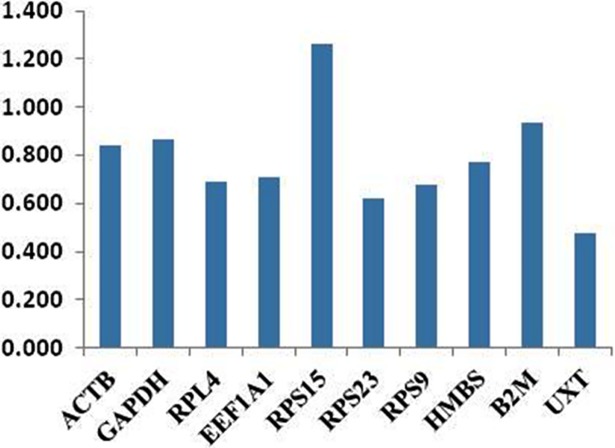
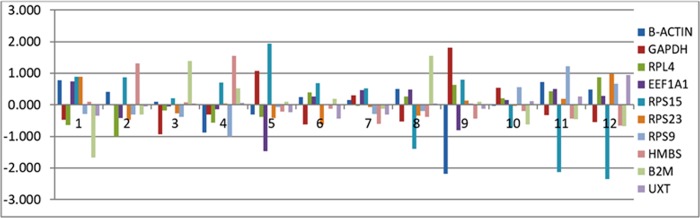
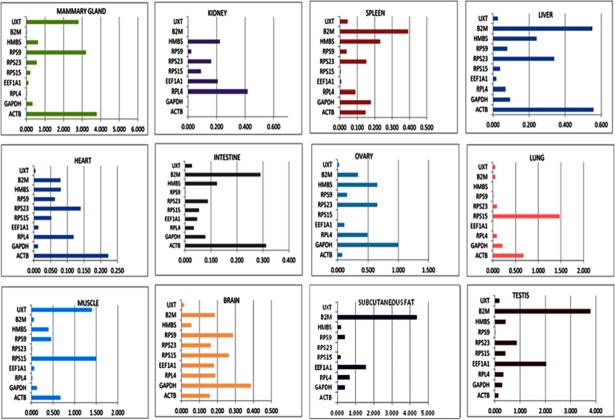
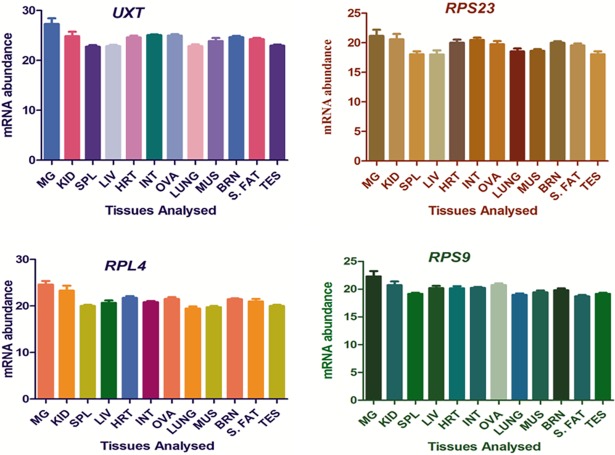
Selection of reference genes has become an integral step in any real time quantitative PCR (RT-qPCR) based expression studies. The importance of this study stems from the fact that riverine buffaloes are major dairy species of Indian sub-continent and the information generated here will be of great interest to the investigators engaged in functional genomic studies of this important livestock species. In this study, an effort was made to evaluate a panel of 10 candidate reference genes (glyceraldehyde 3-phosphate dehydrogenase (GAPDH), beta- actin (ACTB), ubiquitously expressed transcript (UXT), ribosomal protein S15 (RPS15), ribosomal protein L-4 (RPL4), ribosomal protein S9 (RPS9), ribosomal protein S23 (RPS23), hydroxymethylbilane synthase (HMBS), β2 Microglobulin (β2M) and eukaryotic translation elongation factor 1 alpha 1 (EEF1A1) across 12 tissues (mammary gland, kidney, spleen, liver, heart, intestine, ovary, lung, muscle, brain, subcutaneous fat and testis) of riverine buffaloes. In addition to overall analysis, tissue wise evaluation of expression stability of individual RG was also performed. Three different algorithms provided in geNorm, NormFinder and BestKeeper softwares were used to evaluate the stability of 10 potential reference genes from different functional classes. The M-value given by geNorm ranged from 0.9797 (RPS9 and UXT) to 1.7362 (RPS15). From the most stable to the least stable, genes were ranked as: UXT/RPS9> RPL4> RPS23> EEF1A1> ACTB> HMBS> GAPDH> B2M> RPS15. While NormFinder analysis ranked the genes as: UXT> RPS23> RPL4> RPS9> EEF1A1> HMBS> ACTB> β2M> GAPDH> RPS15. Based on the crossing point SD value and range of fold change expression, BestKeeper analysis ranked the genes as: RPS9> RPS23/UXT> RPL4> GAPDH> EEF1A1> ACTB> HMBS> β2M> RPS15. Overall the study has identified RPS23, RPS9, RPL4 and UXT genes to be the most stable and appropriate RGs that could be utilized for normalization of transcriptional data in various tissues of buffaloes. This manuscript thus provide useful information on panel of reference genes that could be helpful for researchers conducting functional genomic studies in riverine buffaloes.
Conflict of interest statement
Figures
References
-
- Livestock Census. All India Report. Department of animal husbandry, dairying and fisheries (2012).
-
- Livak KJ, and Schmittgen TD. Analysis of relative gene expression data using real-time quantitative PCR and the 2− ΔΔCT Method. Methods, 2001; 25: 402–408. doi: 10.1006/meth.2001.1262 - DOI - PubMed
-
- Bustin S.A. Quantification of mRNA using real-time reverse transcription PCR (RT-PCR): trends and problems. Journal of Molecular Endocrinology, 2002; 29: 23–39. - PubMed
-
- Fleige S, Pfaffl MW. RNA integrity and the effect on the real-time qRT-PCR performance. Molecular Aspects of Medicine, 2006; 27: 126–139. doi: 10.1016/j.mam.2005.12.003 - DOI - PubMed
-
- Lisowski P, Pierzchała M, Goscik J, Pareek CS, Zwierzchowski L. Evaluation of reference genes for studies of gene expression in the bovine liver, kidney, pituitary, and thyroid. J Appl Genet, 2008; 49(4): 367–372. doi: 10.1007/BF03195635 - DOI - PubMed
Publication types
MeSH terms
LinkOut - more resources
Full Text Sources
Other Literature Sources
Research Materials
Miscellaneous
