. 2018 Mar 6;13(3):e0192572.
doi: 10.1371/journal.pone.0192572. eCollection 2018.

CENP-C/H/I/K/M/T/W/N/L and hMis12 but not CENP-S/X participate in complex formation in the nucleoplasm of living human interphase cells outside centromeres

Affiliations

CENP-C/H/I/K/M/T/W/N/L and hMis12 but not CENP-S/X participate in complex formation in the nucleoplasm of living human interphase cells outside centromeres

Christian Hoischen et al. PLoS One. .

Abstract

Kinetochore proteins assemble onto centromeric chromatin and regulate DNA segregation during cell division. The inner kinetochore proteins bind centromeres while most outer kinetochore proteins assemble at centromeres during mitosis, connecting the complex to microtubules. Here, we measured the co-migration between protein pairs of the constitutive centromere associated network (CCAN) and hMis12 complexes by fluorescence cross-correlation spectroscopy (FCCS) in the nucleoplasm outside centromeres in living human interphase cells. FCCS is a method that can tell if in living cells two differently fluorescently labelled molecules migrate independently, or co-migrate and thus are part of one and the same soluble complex. We also determined the apparent dissociation constants (Kd) of the hetero-dimers CENP-T/W and CENP-S/X. We measured co-migration between CENP-K and CENP-T as well as between CENP-M and CENP-T but not between CENP-T/W and CENP-S/X. Furthermore, CENP-C co-migrated with CENP-H, and CENP-K with CENP-N as well as with CENP-L. Thus, in the nucleoplasm outside centromeres, a large fraction of the CENP-H/I/K/M proteins interact with CENP-C, CENP-N/L and CENP-T/W but not with CENP-S/X. Our FCCS analysis of the Mis12 complex showed that hMis12, Nsl1, Dsn1 and Nnf1 also form a complex outside centromeres of which at least hMis12 associated with the CENP-C/H/I/K/M/T/W/N/L complex.


Conflict of interest statement

Competing Interests: The authors have declared that no competing interests exist.

Figures

Fig 1
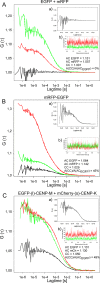
Fig 1. DC-FCCS measurements.
Displayed are G versus lag time. Red: FCS- or autocorrelation-curve G (τ) for mRFP (A,B) or mCherry (C), green: FCS- or autocorrelation-curve G (τ) for EGFP, black: cross-correlation-curve G (τ), AC = autocorrelation. CC = cross-correlation, A(AC) = amplitude of autocorrelation curve, A(CC) = amplitude of cross-correlation curve. The cross-correlation analyses are amplified in inserts a. Count rates are displayed over 1 sec (inserts b; green = EGFP and red = mCherry or mRFP) indicating the absence of larger protein aggregates. (A) EGFP and mRFP expressed as single non-fused proteins (negative control) do not show any cross-correlation (A(CC)/A(ACEGFP) = 0%). The autocorrelations yielded 1.151 and 1.057 for EGFP and mRFP, respectively. The cross-correlation curve (with a magnified scale of G (τ), insert a) resulted in a value of 1.001 indicating the absence of any complexation between EGFP and mRFP. (B) mRFP-EGFP fusion protein (positive control) shows cross-correlation (A(CC)/A(ACEGFP) = 45%). An AC EGFP = 1.064 and an AC mRFP = 1.142 were detected. Cross-correlating the two channels against each other, we obtained a value of 1.029 indicating that about 45% of the molecules are detected as a complex (with a magnified scale of G (τ) in insert a). C) EGFP-(l)-CENP-M and mCherry-(s)-CENP-K indicate complex formation in the nucleoplasm (A(CC)/A(ACEGFP) = 49%). The cross-correlation analysis (with a magnified scale of G (τ); insert a) resulted in a correlation of 1.050, whereas the autocorrelations yielded 1.101 and 1.130 for EGFP-CENP-M and mCherry-CENP-K, respectively. The amplitude of the cross-correlation curve A(CC), relative to the diffusion-related amplitude of one of the autocorrelation curves A(AC) of EGFP or mCherry (in this case A(ACEGFP), is a measure of binding or dynamic colocalization. According to this ratio of amplitudes, up to 49% of nucleoplasmic CENP-M and -K are part of a common (hetero-dimer or larger) complex.
Fig 2
Fig 2. SW-FCCS analysis of CENP-S and CENP-X.
(a): ACF curves of EGFP-(s)-CENP-S (green) and mCherry-(s)-CENP-X (red), and CCF curves (blue, purple) in the nucleoplasm of interphase HEK293 cells. The data show high cross-correlation between CENP-S and CENP-X, indicating an interaction between CENP-S and CENP-X. (b) and (c): Kd determination using Scatter plot (b) and a histogram (c) of multiple SW-FCCS measurements to determine the effective Kd of the interaction.
Fig 3
Fig 3. SW-FCCS analysis of CENP-T and CENP-W.
(a): ACF curves of EGFP-(s)-CENP-W (green) and mCherry-(s)-CENP-T (red), and CCF curves (blue, purple) in the nucleoplasm of interphase HEK293 cells. The data show cross-correlation between CENP-T and CENP-W, indicating interaction. (b) and (c): Kd determination using Scatter plot (b) and a histogram (c) of multiple SW-FCCS measurements to determine an effective Kd of the interaction. (d): ACF curves of EGFP-(s)-CENP-T∆N (green) and mCherry-(s)-CENP-W (red), and CCF curves (blue, purple) in the nucleoplasm of interphase HEK293 cells. The data show reduced cross-correlation between CENP-T∆N and CENP-W. (e) and (f): Kd determination using Scatter plot (e) and a histogram (f) of multiple SW-FCCS measurements to determine the effective Kd of this interaction between the histone-fold domain of CENP-T (CENP-T∆N) and CENP-W. A defined interaction is detected by both, the linear fit of the scatter plot as well as the log-normal fit of the histogram.
Fig 4
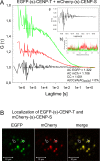
Fig 4. DC-FCCS of EGFP-(s)-CENP-T and mCherry-(s)-CENP-S.
A) Displayed are G versus lag time. Red: FCS- or autocorrelation-curve G (τ) for mCherry, green: FCS- or autocorrelation-curve G (τ) for EGFP, black: cross-correlation-curve G (τ), AC = autocorrelation. CC = cross-correlation, A(AC) = amplitude of autocorrelation curve, A(CC) = amplitude of cross-correlation curve. The cross-correlation analyses are amplified in inserts a. Count rates are displayed over 1 sec (inserts b; green = EGFP and red = mCherry). For the pair EGFP-(s)-CENP-T and mCherry-(s)-CENP-S no indication for complex formation in the nucleoplasm was detected (A(CC)/A(ACmCherry) = 0%). The cross-correlation analysis (with a magnified scale of G (τ); insert a) resulted in a correlation of 1.001, whereas the autocorrelations yielded 1.322 for EGFP-(s)-CENP-T and 1.106 for mCherry-(s)-CENP-S. This ratio indicates that no nucleoplasmic CENP-T and -S are part of a common complex. B) Localization of cotransfected EGFP-(s)-CENP-T (EGFP) and mCherry-(s)-CENP-S (mCherry) in living human HEp-2 cells which were used for FCCS analysis. White bar = 10 μm. A cell nucleus is displayed showing co-localisation at centromeres (merge) and weak fluorescence in the nucleoplasm. Two locations of the same size and shape, a centromere (spot 1) and the centromere-free position of an FCCS measurement, as shown in Fig 4A (spot 2), in the nucleoplasm were selected for fluorescence intensity analysis. For the analyzed centromere in spot 1 the ratios of nucleoplasmic to centromeric fluorescence intensities was 1:43 for EGFP-(s)-CENP-T and 1:33 for mCherry-(s)-CENP-S. The concentrations of nucleoplasmic proteins, estimated by FCCS, was 6 nM for EGFP-(s)-CENP-T and 14 nM for mCherry-(s)-CENP-S.
Fig 5
Fig 5. Protein-protein co-migration of CCAN and Mis12 proteins.
The degree of co-migration (corrected) in the nucleoplasm outside centromeres of human interphase cells is color-coded (red dashed arrows: no or hardly detectable co-migration, green arrow: 5–30%, blue arrows: 30–60%, black arrows: above 60% co-migration). Please note: these green, blue or black arrows do not necessarily indicate direct protein-protein interaction; the labeled proteins co-migrate in a complex: their interaction might be either direct or mediated by a third (or more) protein.

References

    1. Pesenti M, Weir JR, Musacchio A (2016) Progress in the structural and functional characterization of kinetochores. Curr Opin Struc Biol 37:152–163. - PubMed
    1. Nagpal H, Fukagawa T (2016) Kinetochore assembly and function through the cell cycle. Chromosoma 125:645–659. doi: 10.1007/s00412-016-0608-3 - DOI - PubMed
    1. McKinley KL, Cheeseman I.M (2016) The molecular basis for centromere identity and function. Nat Rev Mol Cell Biol 17:16–29. doi: 10.1038/nrm.2015.5 - DOI - PMC - PubMed
    1. Schalch T, Steiner FA (2016) Structure of centromere chromatin: from nucleosome to chromosomal architecture. Chromosoma, doi: 10.1007/s00412-016-0620-7 - DOI - PMC - PubMed
    1. Santaguida S, Musacchio A (2009) The life and miracles of kinetochores. EMBO J 28:2511–2531. doi: 10.1038/emboj.2009.173 - DOI - PMC - PubMed

Publication types

MeSH terms

LinkOut - more resources