Multiplexed immunofluorescence reveals potential PD-1/PD-L1 pathway vulnerabilities in craniopharyngioma
- PMID: 29509940
- PMCID: PMC6280314
- DOI: 10.1093/neuonc/noy035
Multiplexed immunofluorescence reveals potential PD-1/PD-L1 pathway vulnerabilities in craniopharyngioma
Abstract
Background: Craniopharyngiomas are neoplasms of the sellar/parasellar region that are classified into adamantinomatous craniopharyngioma (ACP) and papillary craniopharyngioma (PCP) subtypes. Surgical resection of craniopharyngiomas is challenging, and recurrence is common, frequently leading to profound morbidity. BRAF V600E mutations render PCP susceptible to BRAF/MEK inhibitors, but effective targeted therapies are needed for ACP. We explored the feasibility of targeting the programmed cell death protein 1/programmed death-ligand 1 (PD-1/PD-L1) immune checkpoint pathway in ACP and PCP.
Methods: We mapped and quantified PD-L1 and PD-1 expression in ACP and PCP resections using immunohistochemistry, immunofluorescence, and RNA in situ hybridization. We used tissue-based cyclic immunofluorescence to map the spatial distribution of immune cells and characterize cell cycle and signaling pathways in ACP tumor cells which intrinsically express PD-1.
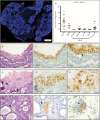
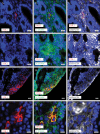
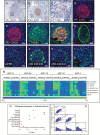
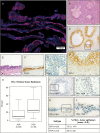
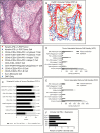
Results: All ACP (15 ± 14% of cells, n = 23, average ± SD) and PCP (35 ± 22% of cells, n = 18) resections expressed PD-L1. In ACP, PD-L1 was predominantly expressed by tumor cells comprising the cyst lining. In PCP, PD-L1 was highly expressed by tumor cells surrounding the stromal fibrovascular cores. ACP also exhibited tumor cell-intrinsic PD-1 expression in whorled epithelial cells with nuclear-localized beta-catenin. These cells exhibited evidence of elevated mammalian target of rapamycin (mTOR) and mitogen-activated protein kinase (MAPK) signaling. Profiling of immune populations in ACP and PCP showed a modest density of CD8+ T cells.
Conclusions: ACP exhibit PD-L1 expression in the tumor cyst lining and intrinsic PD-1 expression in cells proposed to comprise an oncogenic stem-like population. In PCP, proliferative tumor cells express PD-L1 in a continuous band at the stromal-epithelial interface. Targeting PD-L1 and/or PD-1 in both subtypes of craniopharyngioma might therefore be an effective therapeutic strategy.
Figures
Similar articles
-
Adamantinomatous craniopharyngioma: moving toward targeted therapies.Neurosurg Focus. 2020 Jan 1;48(1):E7. doi: 10.3171/2019.10.FOCUS19705. Neurosurg Focus. 2020. PMID: 31896087
-
Comparative immunohistochemical expression of β-catenin, EGFR, ErbB2, and p63 in adamantinomatous and papillary craniopharyngiomas.J Egypt Natl Canc Inst. 2015 Sep;27(3):139-45. doi: 10.1016/j.jnci.2015.06.003. Epub 2015 Jul 18. J Egypt Natl Canc Inst. 2015. PMID: 26198262
-
Immune Microenvironment of Primary and Recurrent Craniopharyngiomas: A Study of the Differences and Clinical Significance.World Neurosurg. 2019 Jul;127:e212-e220. doi: 10.1016/j.wneu.2019.02.212. Epub 2019 Mar 14. World Neurosurg. 2019. PMID: 30880197
-
Recent advances in craniopharyngioma pathophysiology and emerging therapeutic approaches.Front Endocrinol (Lausanne). 2025 May 13;16:1562942. doi: 10.3389/fendo.2025.1562942. eCollection 2025. Front Endocrinol (Lausanne). 2025. PMID: 40433410 Free PMC article. Review.
-
Potential evolution of neurosurgical treatment paradigms for craniopharyngioma based on genomic and transcriptomic characteristics.Neurosurg Focus. 2016 Dec;41(6):E3. doi: 10.3171/2016.9.FOCUS16308. Neurosurg Focus. 2016. PMID: 27903126 Review.
Cited by
-
Current Advances in Papillary Craniopharyngioma: State-Of-The-Art Therapies and Overview of the Literature.Brain Sci. 2023 Mar 20;13(3):515. doi: 10.3390/brainsci13030515. Brain Sci. 2023. PMID: 36979325 Free PMC article. Review.
-
Hyperspectral multiphoton microscopy for in vivo visualization of multiple, spectrally overlapped fluorescent labels.Optica. 2020 Nov 20;7(11):1587-1601. doi: 10.1364/optica.389982. Optica. 2020. PMID: 33928182 Free PMC article.
-
Novel therapeutic approaches for pediatric diencephalic tumors: improving functional outcomes.Front Oncol. 2023 Oct 10;13:1178553. doi: 10.3389/fonc.2023.1178553. eCollection 2023. Front Oncol. 2023. PMID: 37886179 Free PMC article. Review.
-
[Targeted Drug Therapy for Intracranial Tumors].Sichuan Da Xue Xue Bao Yi Xue Ban. 2022 Jul;53(4):564-572. doi: 10.12182/20220760102. Sichuan Da Xue Xue Bao Yi Xue Ban. 2022. PMID: 35871724 Free PMC article. Review. Chinese.
-
Multi-omics analysis of adamantinomatous craniopharyngiomas reveals distinct molecular subgroups with prognostic and treatment response significance.Chin Med J (Engl). 2024 Apr 5;137(7):859-870. doi: 10.1097/CM9.0000000000002774. Epub 2023 Aug 11. Chin Med J (Engl). 2024. PMID: 37565822 Free PMC article.
References
-
- Prabhu VC, Brown HG. The pathogenesis of craniopharyngiomas. Childs Nerv Syst. 2005;21(8–9):622–627. - PubMed
-
- Bunin GR, Surawicz TS, Witman PA, Preston-Martin S, Davis F, Bruner JM. The descriptive epidemiology of craniopharyngioma. J Neurosurg. 1998;89(4):547–551. - PubMed
-
- Louis DN, Ohgaki H, Wiestler OD, Cavenee WK.. WHO Classification of Tumors of the Central Nervous System. Lyon: IARC; 2016. - PubMed
-
- Apps JR, Martinez-Barbera JP. Molecular pathology of adamantinomatous craniopharyngioma: review and opportunities for practice. Neurosurg Focus. 2016;41(6):E4. - PubMed
Publication types
MeSH terms
Substances
Grants and funding
LinkOut - more resources
Full Text Sources
Other Literature Sources
Medical
Research Materials
Miscellaneous

