. 2018 Oct;16(10):1735-1747.
doi: 10.1111/pbi.12910. Epub 2018 Apr 2.

Up-regulation of GhTT2-3A in cotton fibres during secondary wall thickening results in brown fibres with improved quality

Affiliations

Up-regulation of GhTT2-3A in cotton fibres during secondary wall thickening results in brown fibres with improved quality

Qian Yan et al. Plant Biotechnol J. 2018 Oct.

Abstract

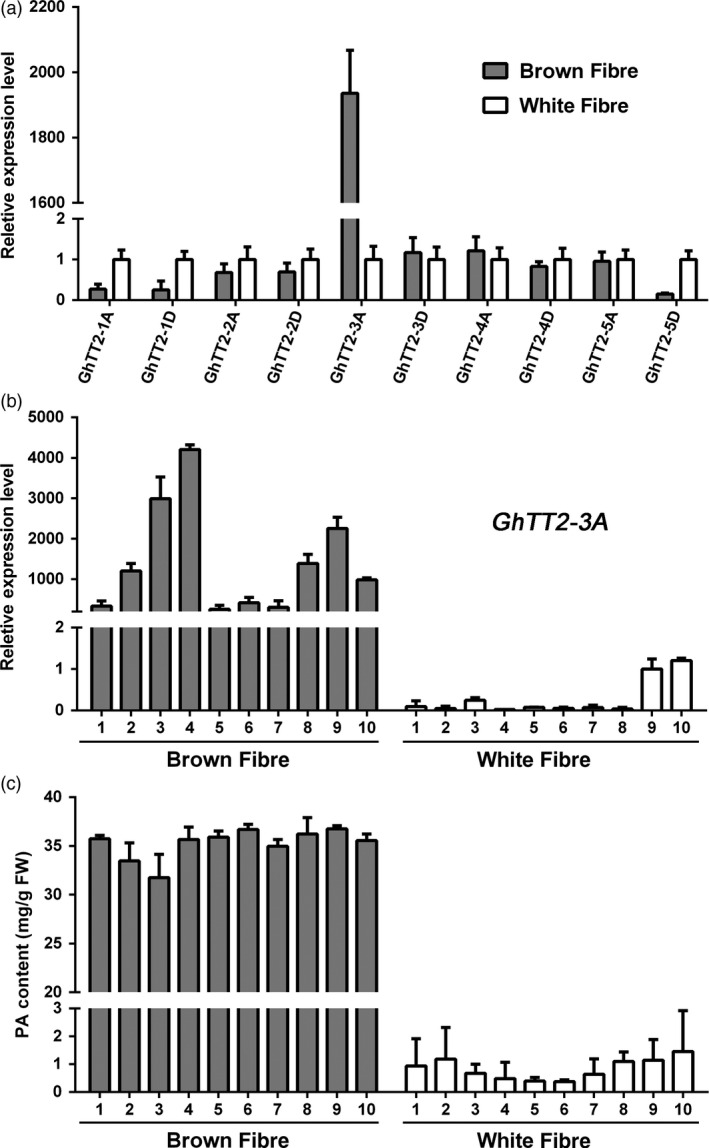
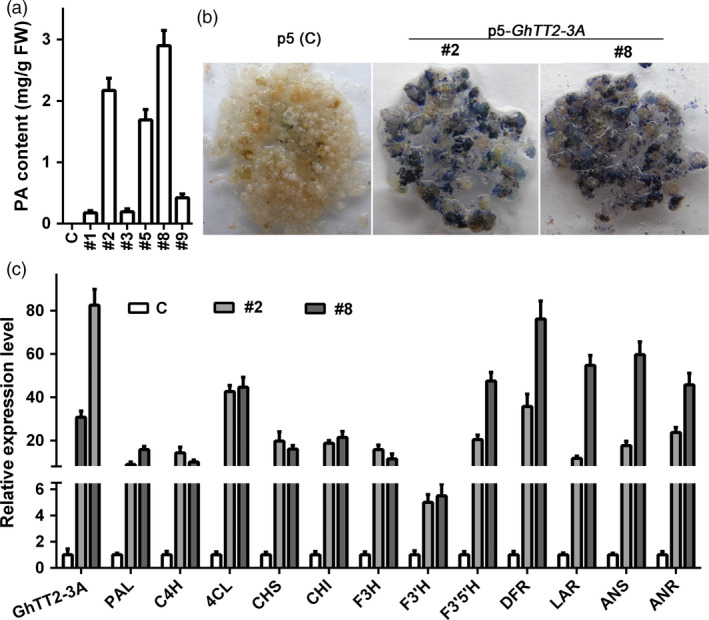
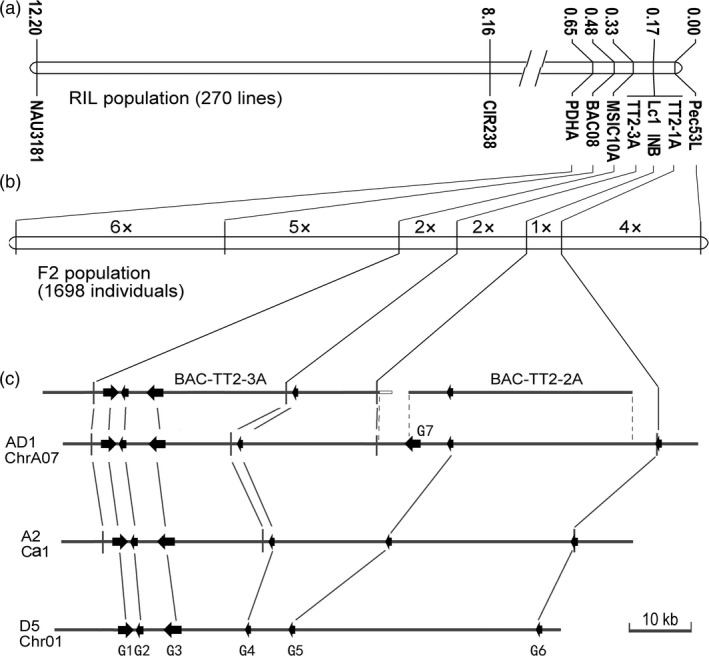
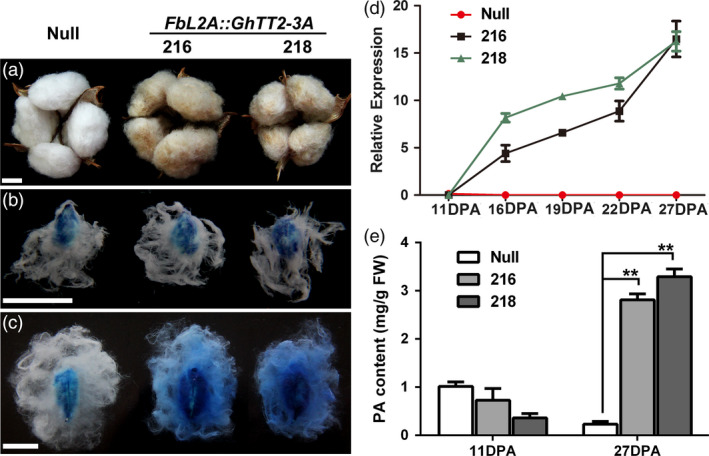
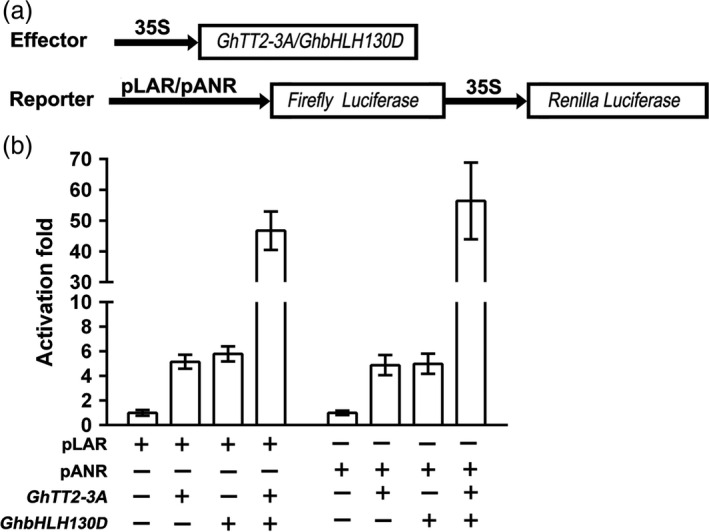
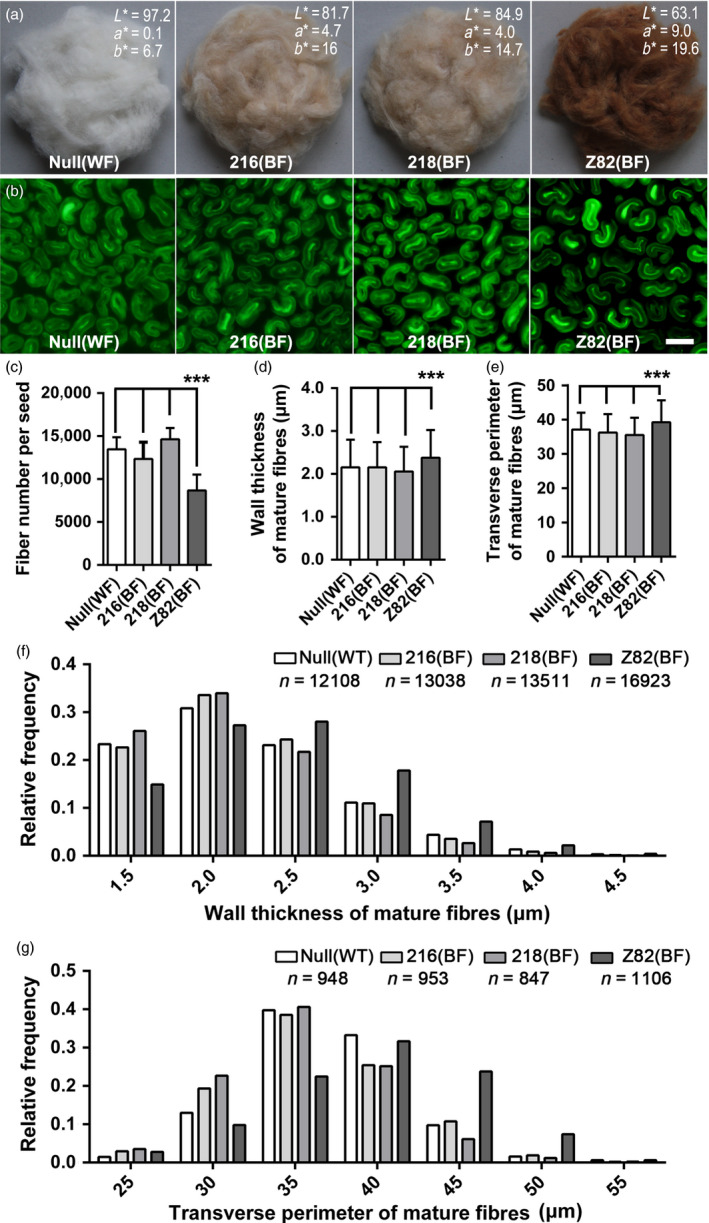
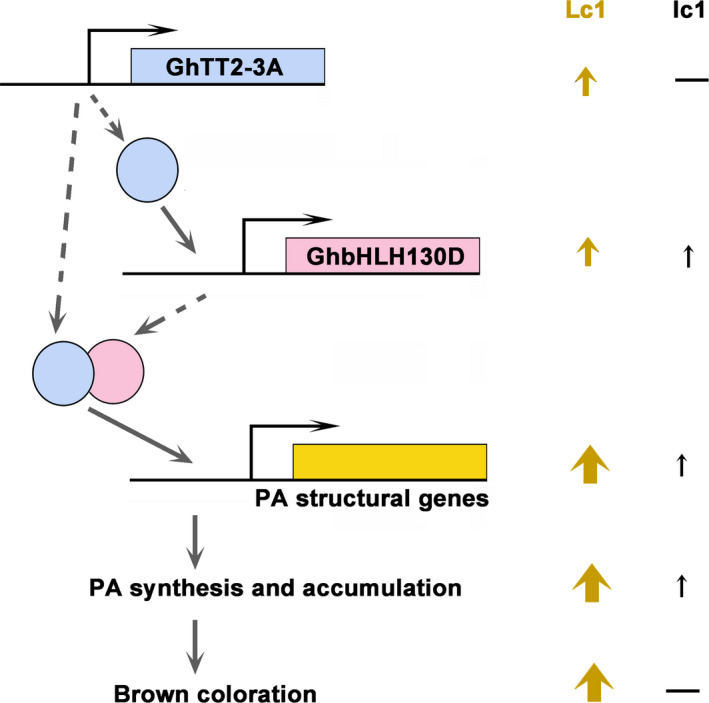
Brown cotton fibres are the most widely used naturally coloured raw materials for the eco-friendly textile industry. Previous studies have indicated that brown fibre pigments belong to proanthocyanidins (PAs) or their derivatives, and fibre coloration is negatively associated with cotton productivity and fibre quality. To date, the molecular basis controlling the biosynthesis and accumulation of brown pigments in cotton fibres is largely unknown. In this study, based on expressional and transgenic analyses of cotton homologs of ArabidopsisPA regulator TRANSPARENT TESTA 2 (TT2) and fine-mapping of the cotton dark-brown fibre gene (Lc1), we show that a TT2 homolog, GhTT2-3A, controls PA biosynthesis and brown pigmentation in cotton fibres. We observed that GhTT2-3A activated GhbHLH130D, a homolog of ArabidopsisTT8, which in turn synergistically acted with GhTT2-3A to activate downstream PA structural genes and PA synthesis and accumulation in cotton fibres. Furthermore, the up-regulation of GhTT2-3A in fibres at the secondary wall-thickening stage resulted in brown mature fibres, and fibre quality and lint percentage were comparable to that of the white-fibre control. The findings of this study reveal the regulatory mechanism controlling brown pigmentation in cotton fibres and demonstrate a promising biotechnological strategy to break the negative linkage between coloration and fibre quality and/or productivity.

Keywords: Gossypium; TT2; brown fibre; proanthocyanidin; transgenic cotton.


Figures

Figure 1
Figure 1
Expression of TT2 homologous genes and PA accumulation in brown and white fibres of RILs. Fibres of 20 DPA of each 10 brown‐ and white‐fibre RILs derived from T586 × Yumian No. 1 were harvested for RNA and PA extraction. (a) qRTPCR analysis of five pairs of TT2 homologous genes using two bulks generated by equally mixing RNAs from each 10 brown‐ and white‐fibre RILs. The white‐fibre bulk was used as control. (b and c) qRTPCR analysis of GhTT2‐3A expression and PA contents in brown and white fibres from various RILs.
Figure 2
Figure 2
GhTT2‐3A promotes PA biosynthesis and accumulation in transgenic cotton calli. Control (c) is the empty vector (p5)‐transformed calli. (a) PA contents in the control and GhTT2‐3A‐transformed calli. (b) PA detection using DMACA staining. (c) qRTPCR analysis of the expression of GhTT2‐3A and PA structural genes. Both homologous PA structural genes from At and Dt subgenomes are amplified as indicated in Figure S8. 4CL, 4‐coumarate:CoA ligase; ANR, anthocyanidin reductase; ANS, anthocyanidin synthase; C4H, cinnamate 4‐hydroxylase; CHI, chalcone isomerase; CHS, chalcone synthase; DFR, dihydroflavonol 4‐reductase; F3H, flavone 3‐hydroxylase; F3′H, flavonoid 3′‐hydroxylase; F3′5′H, flavonoid 3′5′‐hydroxylase; LAR, leucoanthocyanidin reductase; PAL, phenylalanine ammonia lyase.
Figure 3
Figure 3
Fine‐mapping of the Lc1 gene. (a and b) the genetic map of Lc1 region constructed using RIL and enlarged F2 population, respectively. Markers in A are indicated along with the genetic distance calculated according to recombinant frequency. The map in B is drawn to scale to the genetic distance, with the number of recombination events indicated in the intervals between markers. (c) Contig analysis of Lc1 region in G. hirsutum (AD1) and collinearity with G. arboreum (A2) and G. raimondii (D5). Two BACs and the corresponding region from G. hirsutum genome sequence (JGI v1.1) are aligned. The BACs (BACTT2‐2‐3A and BACTT2‐2A) are screened from the BAC libraries of T586 and Yumian No. 1 using gene‐specific primers (Table S5). The borders of overlapped sequences are indicated by dashed lines. Identical or homologous loci are represented by solid lines. Arrows show annotated protein‐coding genes (Table S2). G1–G6 represent the annotated genes Gorai.001G020900–001G020400 in G. raimondii, respectively. G2 in AD1 and A2, and G5 in A2, which are not annotated in the original genome sequencing projects, are validated according to sequence similarity to G. raimondii genes. G7 may be a recently amplified gene, for only one copy was detected in G. arboreum (Cotton_A_32686) and G. raimondii (Gorai.009G304100), whereas a total of 16 copies, including the collinear homologs (Gohir.A05G287800 and Gohir.D05G289000), are identified in the assembled G. hirsutum genome (Table S2). The open bar at the end of BACTT2‐3A indicates the inversed fragment that is homologous to Gorai.001G009800 in G. raimondii.
Figure 4
Figure 4
Up‐regulation of GhTT2‐3A in transgenic cotton fibres at the secondary wall‐thickening stage. (a) Opened bolls with mature fibres; (b and c) DMACA staining of 11‐ and 27‐DPA ovules and fibres, respectively; (d) qRTPCR analysis of GhTT2‐3A transcription during fibre development; (e) levels of soluble PAs in 11‐ and 27‐DPA fibres. **Indicates significant increase (t‐test, < 0.01) in PA content in transgenic fibres compared to the null segregant. Bars = 1 cm.
Figure 5
Figure 5
Synergistic activation of cotton LAR and ANR promoters by GhTT2‐3A and GhbHLH130D. (a) Schematic of the expression cassettes of effector and reporter vectors. (b) the activation effects on the promoters of LAR and ANR genes. The activator and Renilla luciferase genes are driven by CaMV35S promoter (35S). The promoter activities are presented as the activity ratio of firefly to Renilla luciferases.
Figure 6
Figure 6
Characterization of mature FbL2A:GhTT2‐3A transgenic fibres. (a) The ginned mature fibres with the average CIE colour space values of 10 measurements (L*a*b*) indicated. L* indicates whiteness (0 =  black; 100 =  white); a* indicates colours from greenish (negative values) to reddish (positive values); and b* represents colours from bluish (negative values) to yellowish (positive values). (b) The micrographs of transverse sections of mature fibres. Bar = 20 μm. (c) Number of fibres per seed. (d) Wall thickness of mature fibres. (e) Transverse perimeter of mature fibres. (f and g) Frequency distributions of data in d and e, respectively. Error bars represent standard deviations, and ***indicates significant difference (< 0.0001), compared with Lc1 control (Z82).
Figure 7
Figure 7
The regulatory model controlling brown coloration in cotton fibres by GhTT2‐3A. Coding genes are depicted as bars with line and arrow showing promoter and transcription direction, respectively. Proteins are represented with circles filled with identical colour as coding genes, which linked by dashed arrows. Solid arrows suggest activation or promotion effects on the next events. Upright arrows and dashes (—) indicate the presence and absence of certain event, respectively, and arrow sizes indicate approximately the levels of gene transcription, PA accumulation or brown coloration in the brown (Lc1) and white (lc1) fibres.

Similar articles

Cited by

References

    1. Akagi, T. , Ikegami, A. , Tsujimoto, T. , Kobayashi, S. , Sato, A. , Kono, A. and Yonemori, K. (2009) DkMyb4 is a Myb transcription factor involved in proanthocyanidin biosynthesis in persimmon fruit. Plant Physiol. 151, 2028–2045. - PMC - PubMed
    1. Anders, S. and Huber, W. (2010) Differential expression analysis for sequence count data. Genome Biol. 11, R106. - PMC - PubMed
    1. Appelhagen, I. , Thiedig, K. , Nordholt, N. , Schmidt, N. , Huep, G. , Sagasser, M. and Weisshaar, B. (2014) Update on transparent testa mutants from Arabidopsis thaliana: characterisation of new alleles from an isogenic collection. Planta, 240, 955–970. - PubMed
    1. Appelhagen, I. , Nordholt, N. , Seidel, T. , Spelt, K. , Koes, R. , Quattrochio, F. , Sagasser, M. et al. (2015) TRANSPARENT TESTA 13 is a tonoplast P3A ‐ATPase required for vacuolar deposition of proanthocyanidins in Arabidopsis thaliana seeds. Plant J. 82, 840–849. - PubMed
    1. Artico, S. , Nardeli, S.M. , Brilhante, O. , Grossi‐de‐Sa, M.F. and Alves‐Ferreira, M. (2010) Identification and evaluation of new reference genes in Gossypium hirsutum for accurate normalization of real‐time quantitative RT‐PCR data. BMC Plant Boil. 10, 49. - PMC - PubMed

Publication types

Associated data