. 2018 Apr;27(7):1524-1540.
doi: 10.1111/mec.14546. Epub 2018 Apr 2.

Lineage-specific plasmid acquisition and the evolution of specialized pathogens in Bacillus thuringiensis and the Bacillus cereus group

Affiliations

Lineage-specific plasmid acquisition and the evolution of specialized pathogens in Bacillus thuringiensis and the Bacillus cereus group

Guillaume Méric et al. Mol Ecol. 2018 Apr.

Abstract

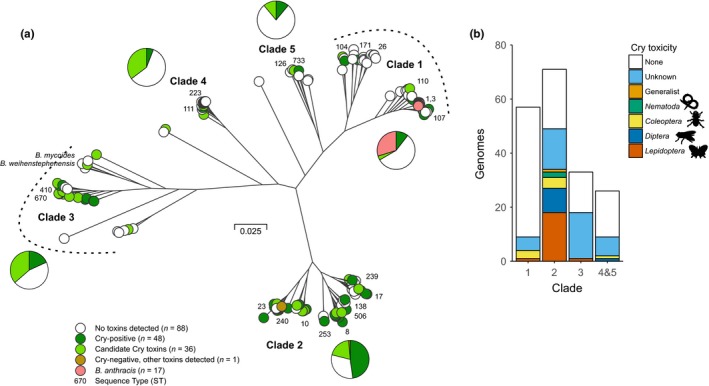
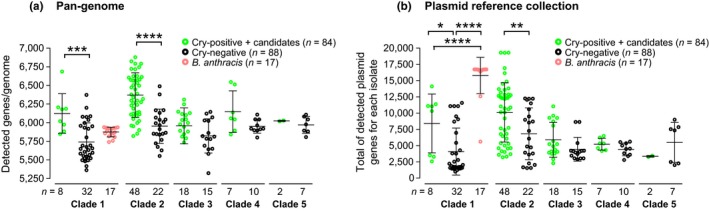
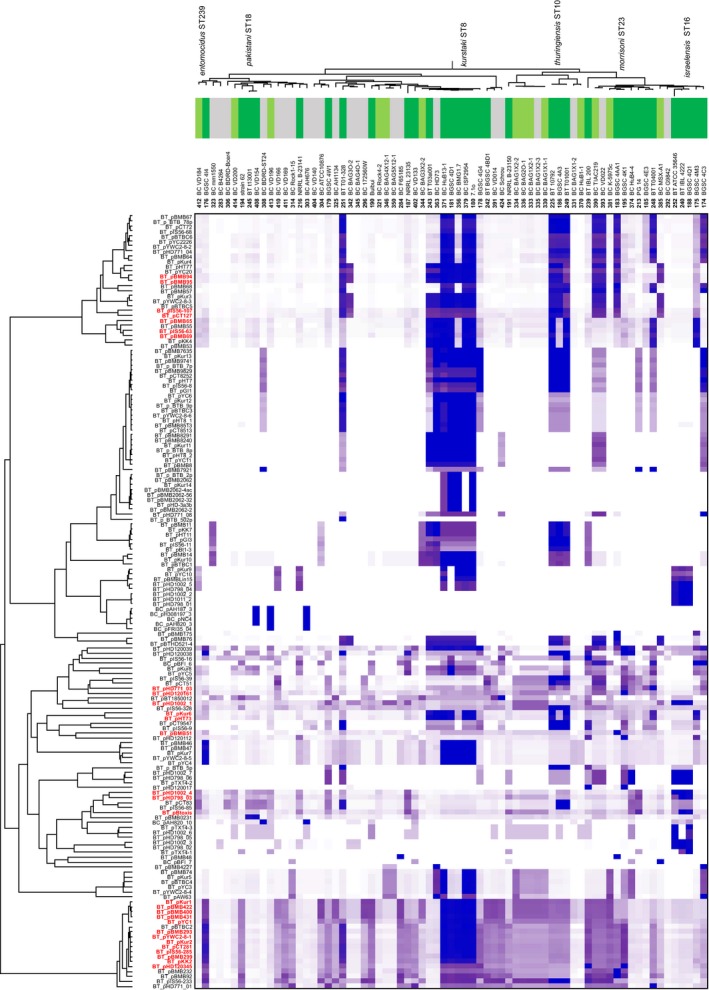
Bacterial plasmids can vary from small selfish genetic elements to large autonomous replicons that constitute a significant proportion of total cellular DNA. By conferring novel function to the cell, plasmids may facilitate evolution but their mobility may be opposed by co-evolutionary relationships with chromosomes or encouraged via the infectious sharing of genes encoding public goods. Here, we explore these hypotheses through large-scale examination of the association between plasmids and chromosomal DNA in the phenotypically diverse Bacillus cereus group. This complex group is rich in plasmids, many of which encode essential virulence factors (Cry toxins) that are known public goods. We characterized population genomic structure, gene content and plasmid distribution to investigate the role of mobile elements in diversification. We analysed coding sequence within the core and accessory genome of 190 B. cereus group isolates, including 23 novel sequences and genes from 410 reference plasmid genomes. While cry genes were widely distributed, those with invertebrate toxicity were predominantly associated with one sequence cluster (clade 2) and phenotypically defined Bacillus thuringiensis. Cry toxin plasmids in clade 2 showed evidence of recent horizontal transfer and variable gene content, a pattern of plasmid segregation consistent with transfer during infectious cooperation. Nevertheless, comparison between clades suggests that co-evolutionary interactions may drive association between plasmids and chromosomes and limit wider transfer of key virulence traits. Proliferation of successful plasmid and chromosome combinations is a feature of specialized pathogens with characteristic niches (Bacillus anthracis, B. thuringiensis) and has occurred multiple times in the B. cereus group.

Keywords: Bacillus cereus; Bacillus thuringiensis; insecticidal toxins; mobile genetic elements; pan-genome.


Figures

Figure 1
Figure 1
Phylogeny of 190 genomes and cry toxicity in the Bacillus cereus species complex. (a) The phylogenetic tree was reconstructed using gene‐by‐gene concatenated alignments of 2,274 core genes, and an approximation of the maximum‐likelihood algorithm implemented in RAxML. The scale represents the number of substitutions per site. Clades previously defined by multilocus sequence typing are specified in bold. cry endotoxin genes were identified in the genomes with BtToxin_scanner software and are indicated as present (green) or absent (white) for each genome. Isolates from the Bacillus anthracis clade are shown in pink. Numbers next to the tip of branches on the tree indicate sequence types from the B. cereus pubMLST database (https://pubmlst.org/bcereus/). (b) Inferred invertebrate host range of B. cereus group isolates based on known toxicity spectra of cry genes present in genomes. Host range allocations are detailed in Table S1 and based on data in van Frankenhuyzen (2009) and sources within the Cry nomenclature database (Crickmore et al., 2016)) [Colour figure can be viewed at http://www.wileyonlinelibrary.com/]
Figure 2
Figure 2
Detection of chromosomal and plasmid genes in Bacillus cereus group isolates. (a) Number of detected genes from a pan‐genome reference list of 27,016 genes in 190 B. cereus group clades and Cry‐positive and Cry‐negative groups (as defined in Figure 1). (b) Total number of detected genes from an unfiltered list of genes present in 410 full plasmids. The number of isolates within each group is indicated below each distribution plot. Significance of the difference in distribution averages was calculated after a one‐way ANOVA with Sidak's multiple comparison tests, with significance summarized as follows: ****: < .0001, **: < .01 [Colour figure can be viewed at http://www.wileyonlinelibrary.com/]
Figure 3
Figure 3
Allelic diversity of Cry‐positive and Cry‐negative Bacillus cereus and Bacillus anthracis isolates. Allelic diversity was compared by calculating the number of unique alleles per isolate for 2,192 core genes shared by all isolates of the data set. (a) Overall distribution shown as boxplots (min. to max.), with statistical significance between the distribution inferred using a Kruskal–Wallis test with Dunn's multiple comparison tests, with significances summarized as follows: ****, < .0001. (b) Frequency distribution of core allelic diversity in each group. (c) Gene‐by‐gene comparison of allelic diversity/isolate between Cry‐positive and Cry‐negative isolates for each of 2,192 core genes (circles). The proportionality line of equal allelic diversity between the two groups is shown in red. (d) Distribution shown as boxplots (min. to max.) for each clade (1 to 3, excluding B. anthracis from clade 1 isolates). Each group was statistically different from one another (Kruskal–Wallis test with Dunn's multiple comparison tests; < .0001; except clade 2 vs. clade 4 which were not; = .1306). (d) Frequency distribution of core allelic diversity in each clade [Colour figure can be viewed at http://www.wileyonlinelibrary.com/]
Figure 4
Figure 4
Prevalence of 410 plasmids in 190 Bacillus cereus group isolates. The presence of 44,759 plasmid genes from 410 plasmid reference sequences (rows) was examined in 190 genomes (columns), and the proportion of detected plasmid genes per plasmid reference sequence was calculated for each isolate. On the heatmap, blue indicates 100% of genes from that plasmid are in the genome with progressively lighter shades of purple indicating decreasing prevalence to white (fewer than 30% of genes are detected). The source of plasmid isolations (coloured row headers) and the “species” of the bacterial genome examined (coloured column headers) are given for Bacillus anthracis (pink), Bacillus thuringiensis or Cry‐positive isolate (green), B. cereus or Cry‐negative isolate (grey). Isolates are ordered by the tree (Figure 1a), and plasmids are clustered based on gene prevalence patterns inferred by WebGimm (Joshi et al., 2011) using the context‐specific infinite mixture model (Freudenberg et al., 2010). Names on the figure indicate known plasmid names of interest [Colour figure can be viewed at http://www.wileyonlinelibrary.com/]
Figure 5
Figure 5
Prevalence of 116 selected plasmids in 71 clade 2 Bacillus cereus group isolates. Visualization is complementary to, and focuses on, specific plasmids and isolates from Figure 4. Isolates are ordered by the phylogeny from Figure 1 and plasmids from which >90% of genes were detected in at least 1 clade 2 isolate (n = 116) are clustered based on gene prevalence patterns inferred by WebGimm (Joshi et al., 2011) using the context‐specific infinite mixture model (Freudenberg et al., 2010). The plasmid names in red indicate Cry‐harbouring plasmids as inferred from a BtToxin_scanner analysis presented in Table S3 [Colour figure can be viewed at http://www.wileyonlinelibrary.com/]

Similar articles

Cited by

References

    1. Altschul, S. F. , Gish, W. , Miller, W. , Myers, E. W. , & Lipman, D. J. (1990). Basic local alignment search tool. Journal of Molecular Biology, 215, 403–410. https://doi.org/10.1016/S0022-2836(05)80360-2 - DOI - PubMed
    1. Antonation, K. S. , Grutzmacher, K. , Dupke, S. , Mabon, P. , Zimmermann, F. , Lankester, F. , … de Nys, H. M. (2016). Bacillus cereus biovar anthracis causing anthrax in sub‐saharan Africa‐chromosomal monophyly and broad geographic distribution. PLoS Neglected Tropical Diseases, 10, e0004923. - PMC - PubMed
    1. Aziz, R. K. , Bartels, D. , Best, A. A. , DeJongh, M. , Disz, T. , Edwards, R. A. , … Meyer, F. (2008). The RAST Server: Rapid annotations using subsystems technology. BMC Genomics, 9, 75 https://doi.org/10.1186/1471-2164-9-75 - DOI - PMC - PubMed
    1. Bergstrom, C. T. , Lipsitch, M. , & Levin, B. R. (2000). Natural selection, infectious transfer and the existence conditions for bacterial plasmids. Genetics, 155, 1505–1519. - PMC - PubMed
    1. Berry, C. , O'Neil, S. , Ben‐Dov, E. , Jones, A. F. , Murphy, L. , Quail, M. A. , … Parkhill, J. (2002). Complete sequence and organization of pBtoxis the toxin‐coding plasmid of Bacillus thuringiensis subsp. israelensis . Applied and Environment Microbiology, 68, 5082–5095. https://doi.org/10.1128/AEM.68.10.5082-5095.2002 - DOI - PMC - PubMed

Publication types

LinkOut - more resources