. 2018 Mar 6;19(1):181.
doi: 10.1186/s12864-018-4564-6.

Characterization of the human RFX transcription factor family by regulatory and target gene analysis

Affiliations

Characterization of the human RFX transcription factor family by regulatory and target gene analysis

Debora Sugiaman-Trapman et al. BMC Genomics. .

Abstract

Background: Evolutionarily conserved RFX transcription factors (TFs) regulate their target genes through a DNA sequence motif called the X-box. Thereby they regulate cellular specialization and terminal differentiation. Here, we provide a comprehensive analysis of all the eight human RFX genes (RFX1-8), their spatial and temporal expression profiles, potential upstream regulators and target genes.

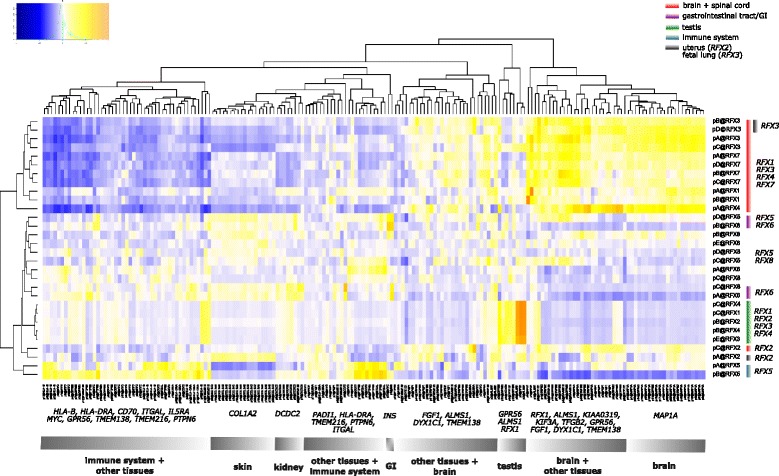
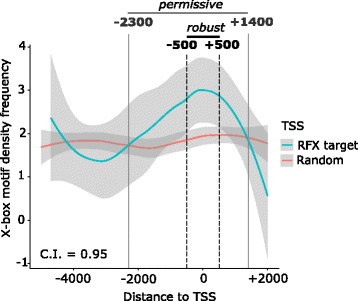
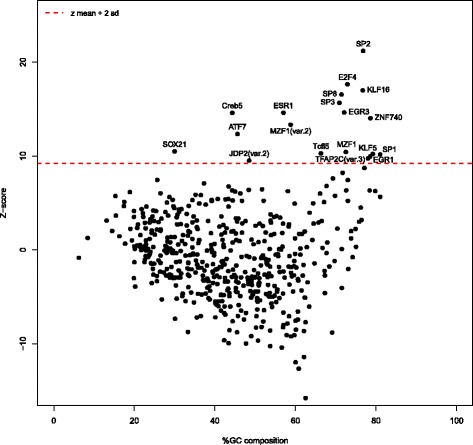
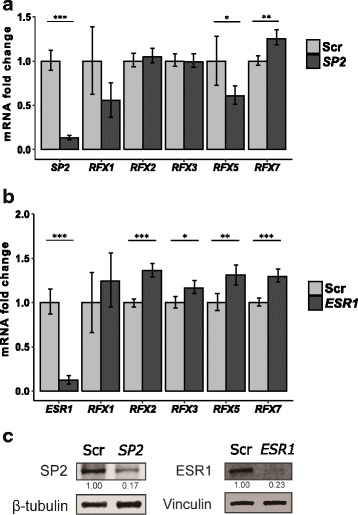
Results: We extracted all known human RFX1-8 gene expression profiles from the FANTOM5 database derived from transcription start site (TSS) activity as captured by Cap Analysis of Gene Expression (CAGE) technology. RFX genes are broadly (RFX1-3, RFX5, RFX7) and specifically (RFX4, RFX6) expressed in different cell types, with high expression in four organ systems: immune system, gastrointestinal tract, reproductive system and nervous system. Tissue type specific expression profiles link defined RFX family members with the target gene batteries they regulate. We experimentally confirmed novel TSS locations and characterized the previously undescribed RFX8 to be lowly expressed. RFX tissue and cell type specificity arises mainly from differences in TSS architecture. RFX transcript isoforms lacking a DNA binding domain (DBD) open up new possibilities for combinatorial target gene regulation. Our results favor a new grouping of the RFX family based on protein domain composition. We uncovered and experimentally confirmed the TFs SP2 and ESR1 as upstream regulators of specific RFX genes. Using TF binding profiles from the JASPAR database, we determined relevant patterns of X-box motif positioning with respect to gene TSS locations of human RFX target genes.

Conclusions: The wealth of data we provide will serve as the basis for precisely determining the roles RFX TFs play in human development and disease.

Keywords: Cell cycle control; Cell differentiation; Cilia; Immune cell proliferation; Neuronal development; Spermatogenesis; Tumor suppression.


Conflict of interest statement

Ethics approval and consent to participate

For work with mammalian cell cultures the authors are in possession of the applicable permits for carrying out studies with genetically modified micro-organisms / GMMs (Dnr 5.8.18–1012/14; Dnr 5.5.18–6998/15).

Consent for publication

This section is not applicable.

Competing interests

The authors declare that they have no competing interests.

Publisher’s Note

Springer Nature remains neutral with regard to jurisdictional claims in published maps and institutional affiliations.

Figures

Fig. 1
Fig. 1
Representative RFX transcripts grouped according to their functional domain compositions. a Representative RFX transcripts (to scale in nucleotides / nt) can be categorized based on the presence or absence of functional domains. Group 1 consists of RFX1, RFX2, and RFX3, which have all the domains. Group 2 consists of RFX4, RFX6 and RFX8, which have all domains but the AD. Group 3 consists of RFX5 and RFX7, which have only the DBD. Group 4 is novel, consisting of isoforms of RFX4 and RFX8, which lack the DBD. The start of the black bar marks the TSS position. Green and red arrows mark start and stop codon positions, respectively. The RFX protein domains encoded by these transcripts are AD (activation domain), DBD (DNA binding domain), B (domain B), C (domain C), and DIM (dimerization domain). They are indicated using color-coded boxes. The DBD (red box), which typically spans 222–225 nt (cf. Table S2 in Additional file 3) serves as a size marker. b, c RFX4 and RFX8 TSS locations illustrate best that RFX functional domain composition is independent of expression profile. They are connected to Ensembl protein-coding transcripts or shown as novel, validated transcripts (in red). Exon numbers refer to those in the corresponding Ensembl transcript IDs (distance and positions are not to scale). pA@RFX4 (red) belongs to the brain and spinal cord cluster, whereas pB and pC@RFX4 (green) belong to the testis cluster (cf. Additional file 2). The highest expressed tissues for pA and pB@RFX8 are thymus and medial frontal gyrus, respectively, and they are not color-coded because of their low expression levels in tags per million (TPM < 5) (Table 1)
Fig. 2
Fig. 2
Heat map of tissue expression clusters of RFX1–8 and their experimentally confirmed target genes in humans. Heat map of unsupervised hierarchical clustering of 30 TSS locations of RFX genes and 185 TSS locations of validated RFX target genes (with shorthand p for promoter) based on the expression values in tags per million (TPM) across 135 human tissue samples extracted from FANTOM5. The heat map color-code represent Pearson correlation values with a gradient of − 1 in dark blue/blue (negative correlation), 0 in white (zero correlation) and 1 in yellow/orange (positive correlation). The graph was generated by the heatmap.2::gplots [95] R package. RFX TSS locations tissue clusters (y-axis) are color-coded as described in Additional file 2. The tissue cluster divisions of RFX target genes (x-axis) are based on groups of tissues with the highest expression values (TPM) of the respective TSS locations. The term “other tissues” includes adipose, kidney, lung, seminal vesicle, skeletal muscle, throat and uterus
Fig. 3
Fig. 3
X-box motif position with respect to TSS locations. Density frequency of X-box motif positions with respect to the TSS locations of experimentally proven direct RFX target genes in humans (shown in blue) and a set of 10× random TSS locations from FANTOM5 (shown in red): TSS -5000 to + 2000 bp windows were scanned with two JASPAR RFX motifs (RFX2 MA0600.1 and RFX5 MA0510.1) with 80% threshold. We define a sequence window as “robust” by the area where the two curves with 95% C.I. smoothing do not overlap. We define a sequence window as “permissive” by the area where the two curves intersect
Fig. 4
Fig. 4
TF binding profiles in the promoter and enhancer regions of RFX genes. Distribution of all the z-scores of all the core vertebrate transcription factor binding site (TFBS) profiles in JASPAR 2016, with the search areas consisting of − 5000 to + 2000 bp with respect to the 30 RFX TSS locations and − 200 bp to + 200 bp from the mid-points of the RFX enhancers, against a background of a set of 10× random TSS locations and enhancers with identical window size and matching %GC distribution from FANTOM5. High-scoring or over-represented TF binding site profiles were computed as having z-scores above the mean + 2 x standard deviation (red dotted line)
Fig. 5
Fig. 5
siRNA validation of candidate RFX regulators. The genes SP2 and ESR1 represent the high-scoring group of candidate RFX regulators (cf. Fig. 4 and Additional file 4). In the MCF7 breast cancer cell line, amplification efficiency-adjusted mRNA fold change quantifications of RFX1, 2, 3, 5 and 7 were normalized to the geometric mean of HPRT1 and HSPCB, whereby a fold change equaling 1 describes an unchanged expression level. For this we used (a) SP2 siRNA versus scrambled (Scr) control siRNA knockdown, and (b) ESR1 siRNA versus scrambled (Scr) control siRNA knockdown. In (a, b) error bars represent SEM and fold-change statistical significance was calculated using the student two-sample t-test (***p-value ≤0.01, **p-value ≤0.05, *p-value ≤0.1). a, c SP2 siRNA knockdown was confirmed at both the mRNA and protein level and a significant up-regulation of RFX7 and down-regulation of RFX5 were observed. b, c ESR1 siRNA knockdown was confirmed at both the mRNA and protein level and significant up-regulations of RFX2, 3, 5 and 7 were observed. c Immunoblotting band intensities were quantified using ImageJ and normalized with the indicated loading controls

References

    1. Gajiwala KS, Chen H, Cornille F, Roques BP, Reith W, Mach B, Burley SK. Structure of the winged-helix protein hRFX1 reveals a new mode of DNA binding. Nature. 2000;403:916–921. doi: 10.1038/35002634. - DOI - PubMed
    1. Piasecki BP, Burghoorn J, Swoboda P. Regulatory factor X (RFX)-mediated transcriptional rewiring of ciliary genes in animals. Proc Natl Acad Sci. 2010;107(29):12969–12974. doi: 10.1073/pnas.0914241107. - DOI - PMC - PubMed
    1. Durand B, Vandaele C, Spencer D, Pantalacci S, Couble P. Cloning and characterization of dRFX, the drosophila member of the RFX family of transcription factors. Gene. 2000;246(1–2):285–293. doi: 10.1016/S0378-1119(00)00093-7. - DOI - PubMed
    1. Otsuki K, Hayashi Y, Kato M, Yoshida H, Yamaguchi M. Characterization of dRFX2, a novel RFX family protein in drosophila. Nucleic Acids Res. 2004;32(18):5636–5648. doi: 10.1093/nar/gkh895. - DOI - PMC - PubMed
    1. Reith W, Herrero-Sanchez C, Kobr M, Silacci P, Berte C, Barras E, Fey S, Mach B. MHC class II regulatory factor RFX has a novel DNA binding domain and functionally independant dimerization domain. Genes Dev. 1990;4:1528–1540. doi: 10.1101/gad.4.9.1528. - DOI - PubMed

Publication types

MeSH terms

Substances

LinkOut - more resources