. 2018 Mar 6;19(1):180.
doi: 10.1186/s12864-018-4496-1.

Summarizing performance for genome scale measurement of miRNA: reference samples and metrics

Affiliations

Summarizing performance for genome scale measurement of miRNA: reference samples and metrics

P Scott Pine et al. BMC Genomics. .

Abstract

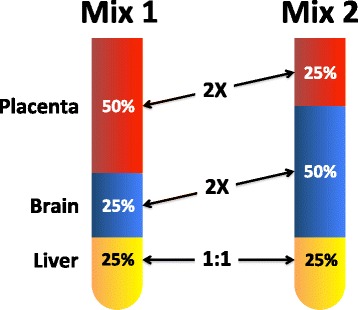
Background: The potential utility of microRNA as biomarkers for early detection of cancer and other diseases is being investigated with genome-scale profiling of differentially expressed microRNA. Processes for measurement assurance are critical components of genome-scale measurements. Here, we evaluated the utility of a set of total RNA samples, designed with between-sample differences in the relative abundance of miRNAs, as process controls.

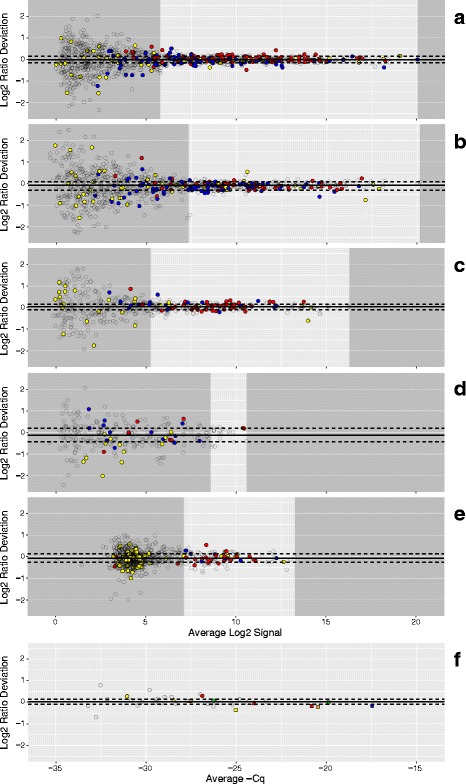
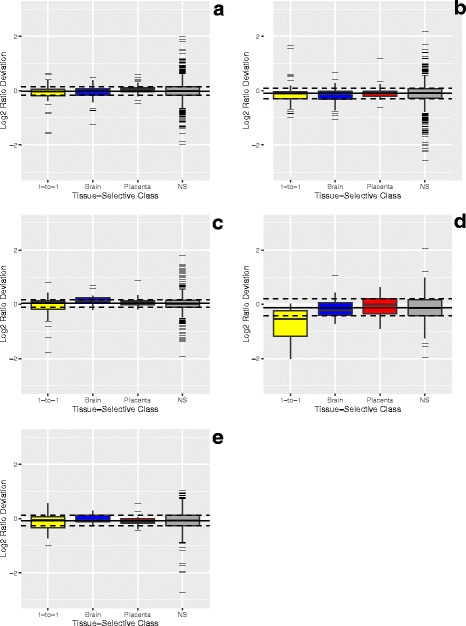
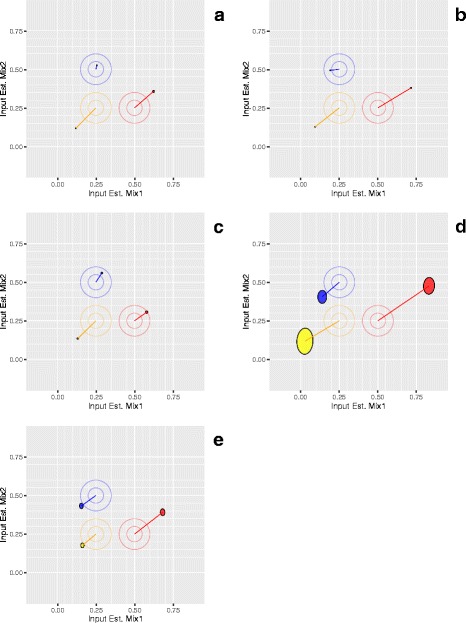
Results: Three pure total human RNA samples (brain, liver, and placenta) and two different mixtures of these components were evaluated as measurement assurance control samples on multiple measurement systems at multiple sites and over multiple rounds. In silico modeling of mixtures provided benchmark values for comparison with physical mixtures. Biomarker development laboratories using next-generation sequencing (NGS) or genome-scale hybridization assays participated in the study and returned data from the samples using their routine workflows. Multiplexed and single assay reverse-transcription PCR (RT-PCR) was used to confirm in silico predicted sample differences. Data visualizations and summary metrics for genome-scale miRNA profiling assessment were developed using this dataset, and a range of performance was observed. These metrics have been incorporated into an online data analysis pipeline and provide a convenient dashboard view of results from experiments following the described design. The website also serves as a repository for the accumulation of performance values providing new participants in the project an opportunity to learn what may be achievable with similar measurement processes.

Conclusions: The set of reference samples used in this study provides benchmark values suitable for assessing genome-scale miRNA profiling processes. Incorporation of these metrics into an online resource allows laboratories to periodically evaluate their performance and assess any changes introduced into their measurement process.

Keywords: Dashboard; Process controls; Reference samples; miRNA; microRNA.


Conflict of interest statement

Ethics approval and consent to participate

Not applicable. Human Brain Reference RNA (Cat. No. AM6050), Human Liver Total RNA (Cat. No. AM7960), and Human Placenta Total RNA (Cat. No. AM7950) was obtained from Ambion (Thermo Fisher Scientific).

Consent for publication

Not applicable.

Competing interests

The authors declare that they have no competing interest.

Figures

Fig. 1
Fig. 1
The relative input proportions from three total RNA components are shown for Mix1 and Mix2
Fig. 2
Fig. 2
Dashboard view combining visualizations and metrics. Metrics table displays values derived from data visualizations. The legends for Figs. 3, 4, 5, 6, 7 and 8 describe each panel
Fig. 3
Fig. 3
Predicted distribution of log2 ratios. Panels A to F correspond to measurement processes A to F described in Results. For each datapoint in panels A to F, the difference between the predicted Mix1 and Mix2 log2 signals (log2 ratios) is plotted against their average for each detected miRNA. Signal values for each mixture are predicted using Eqs. 1 and 2. Filled circles correspond to predicted values for tissue-selective miRNA (those miRNA that are at least 10 times more prevalent in one pure total RNA tissue type relative to the other two) or miRNA that were approximately equal in relative abundance between placenta and brain (1-to-1): red = placenta-selective, blue = brain-selective, and yellow = 1-to-1 (liver-selective and placenta = brain). Open circles correspond to detectable, but non-selective miRNA. Red, yellow, and blue transparent bands indicate the 95% confidence interval for the loess (locally weighted smoothing) function (black lines) for the placenta, 1-to-1, and brain subsets, respectively. Panel F includes data from three different PCR labs: one site using multiplexed PCR (circles) and two sites using individual PCR assays (squares and triangles). Five miRNA of interest are highlighted: miR-451a (red), miR-335 (orange), miR-375 (yellow), miR-218 (green), miR-125b (blue). The total number of detectable miRNA and their tissue-selective classification are included in the summary table of the dashboard
Fig. 4
Fig. 4
Observed distribution of log2 ratios. Panels A to F correspond to measurement processes A to F described in Results. For each datapoint in panels A to F, the difference between the Mix1 and Mix2 log2 signals (log2 ratios) is plotted against their average for each detected miRNA. Filled circles correspond to observed values for tissue-selective miRNA (those miRNA that are at least 10 times more prevalent in one pure total RNA tissue type relative to the other two) or miRNA that were approximately equal in relative abundance between placenta and brain (1-to-1): red = placenta-selective, blue = brain-selective, and yellow = 1-to-1 (liver-selective and placenta = brain). Open circles correspond to detectable, but non-selective miRNA. Red, yellow, and blue transparent bands indicate the 95% confidence interval for the loess (locally weighted smoothing) function (black lines) for the placenta, 1-to-1, and brain subsets, respectively. Panel F includes data from three different PCR labs: one site using multiplexed PCR (circles) and two sites using individual PCR assays (squares and triangles). Five miRNA of interest are highlighted: miR-451a (red), miR-335 (orange), miR-375 (yellow), miR-218 (green), miR-125b (blue)
Fig. 5
Fig. 5
Deviation from predicted ratios as a function of dynamic range. Panels A to F correspond to measurement processes A to F described in Results. Each datapoint in panels A to F represents the difference between the observed and predicted log2 ratios plotted against the average observed and predicted log2 signal for each detected miRNA. Open circles correspond to all detectable non-selective miRNA and yellow, blue, and red filled circles correspond to 1-to-1, brain-, and placenta-selective miRNA, respectively. The median and interquartile range (IQR) of the deviation from predicted for all detected miRNA are indicated by the solid and dashed horizontal lines, respectively. The lower limit of acceptable dispersion (determined by a user selectable deviation of ±0.585 log2, see Results) and the maximum detectable value are indicated by the margins of the darker grey areas, respectively. Margins were not assessed in Panel F. Panel F includes data from three different PCR labs: one site using multiplexed PCR (circles) and two sites using individual PCR assays (squares and triangles). Five miRNA of interest are highlighted: miR-451a (red), miR-335 (orange), miR-375 (yellow), miR-218 (green), miR-125b (blue). Limits and range included in the summary table of the dashboard
Fig. 6
Fig. 6
Bias and dispersion within tissue-selective classes. Panels A to E correspond to measurement processes A to E described in Results. The bias and dispersion for each tissue-selective class is shown in box (IQR) and whisker (1.5*IQR) format with outliers represented by black hash marks and median values indicated by black line (yellow = 1-to-1, blue = brain, red = placenta, and grey = none-selective (NS)). The median and interquartile range (IQR) of the deviation from predicted for all detected miRNA are indicated by the solid and dashed horizontal lines, respectively
Fig. 7
Fig. 7
Discrimination accuracy. Panels A to E correspond to measurement processes A to E described in Results. Receiver-Operating Characteristic Curves (ROCplots), where true positives correspond to 10X placenta and 10X brain miRNA; and true negatives correspond to 1-to-1 components using either the entire detectable range (solid line) or limited to the reliable region (dashed line). Area under the curve (AUC) values are included in the summary table of the dashboard
Fig. 8
Fig. 8
Deconvolved mixture proportions of tissue components in Mix1 and Mix2. Panels A to E correspond to measurement processes A to E described in Results. Concentric circles added to target values for emphasis. Line segments connect target values (central point of circles) to their corresponding estimates. Ellipses show the 95% confidence interval range of the mixture proportions for the three tissue components (yellow = liver, blue = brain, and red = placenta)

References

    1. Srivastava S, Kramer BS. Early detection cancer research network. Lab Investig. 2000;80(8):1147–8. doi: 10.1038/labinvest.3780122. - DOI - PubMed
    1. Tan PK, et al. Evaluation of gene expression measurements from commercial microarray platforms. Nucleic Acids Res. 2003;31(19):5676–5684. doi: 10.1093/nar/gkg763. - DOI - PMC - PubMed
    1. MAQC Consortium The MicroArray quality control (MAQC) project shows inter- and intraplatform reproducibility of gene expression measurements. Nat Biotechnol. 2006;24(9):1151–1161. doi: 10.1038/nbt1239. - DOI - PMC - PubMed
    1. SEQC/MAQC-III Consortium A comprehensive assessment of RNA-seq accuracy, reproducibility and information content by the sequencing quality control consortium. Nat Biotechnol. 2014;32(9):903–914. doi: 10.1038/nbt.2957. - DOI - PMC - PubMed
    1. Shippy R, et al. Using RNA sample titrations to assess microarray platform performance and normalization techniques. Nat Biotechnol. 2006;24(9):1123–1131. doi: 10.1038/nbt1241. - DOI - PMC - PubMed

Publication types