. 2018 Jun 1;78(11):2990-3001.
doi: 10.1158/0008-5472.CAN-17-2319. Epub 2018 Mar 6.

Tissue Tranglutaminase Regulates Interactions between Ovarian Cancer Stem Cells and the Tumor Niche

Affiliations

Tissue Tranglutaminase Regulates Interactions between Ovarian Cancer Stem Cells and the Tumor Niche

Salvatore Condello et al. Cancer Res. .

Abstract

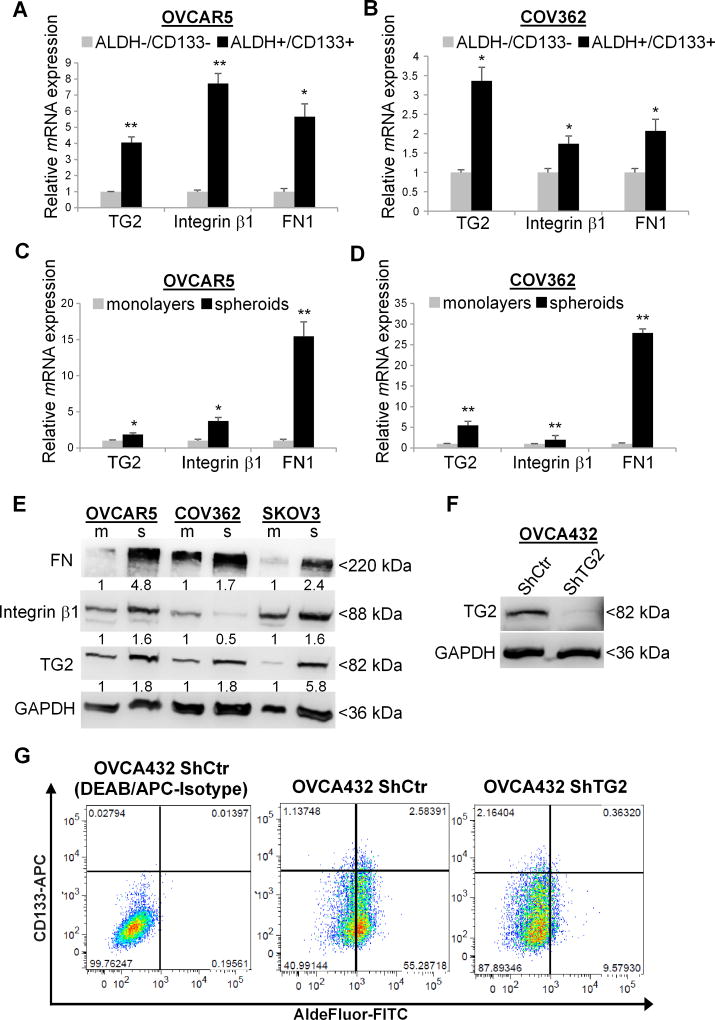
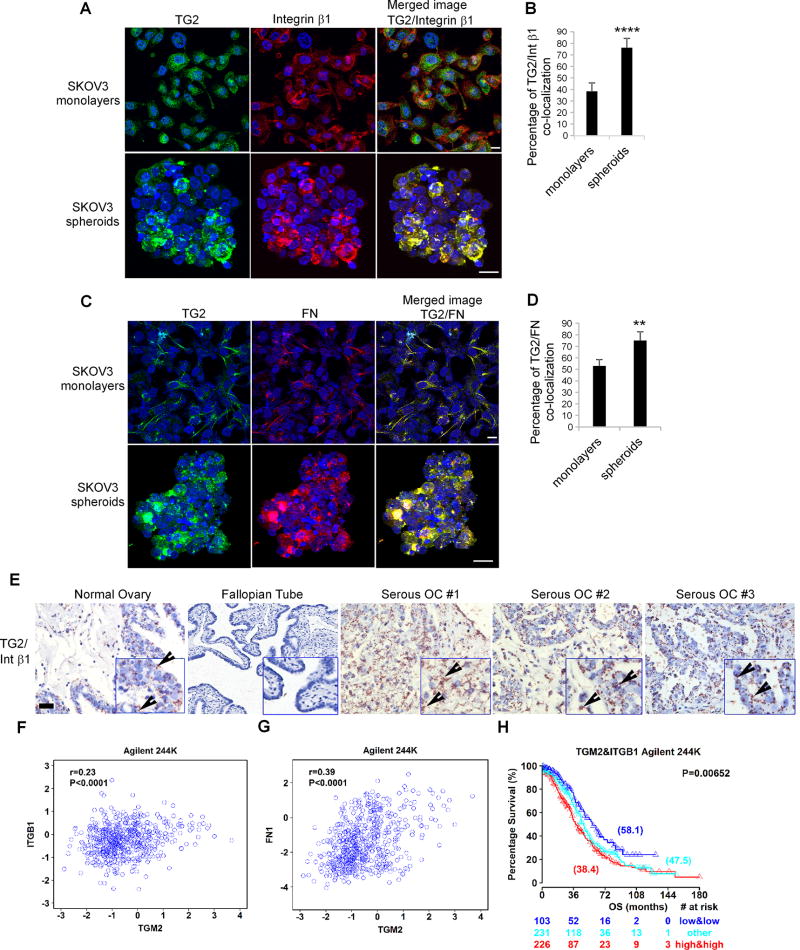
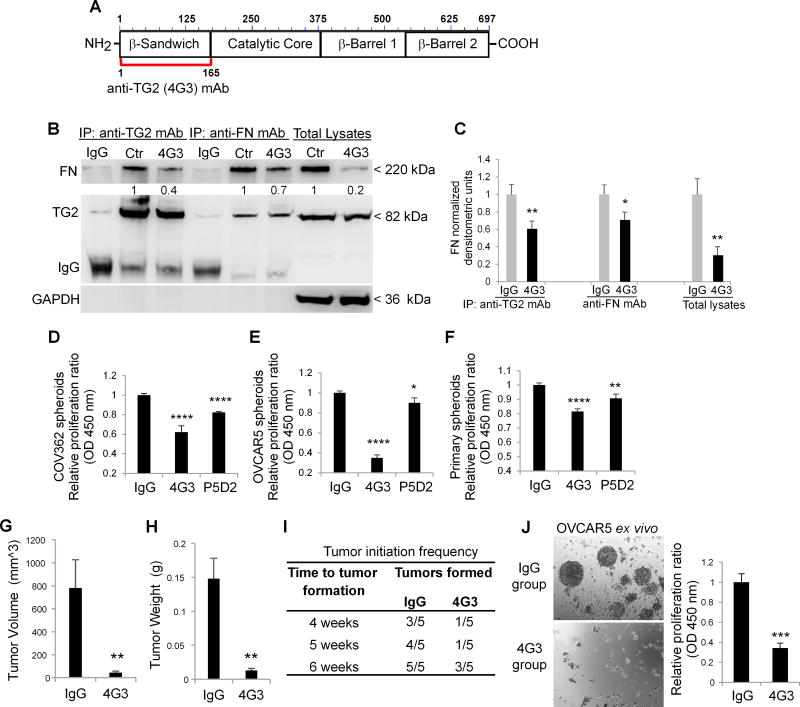
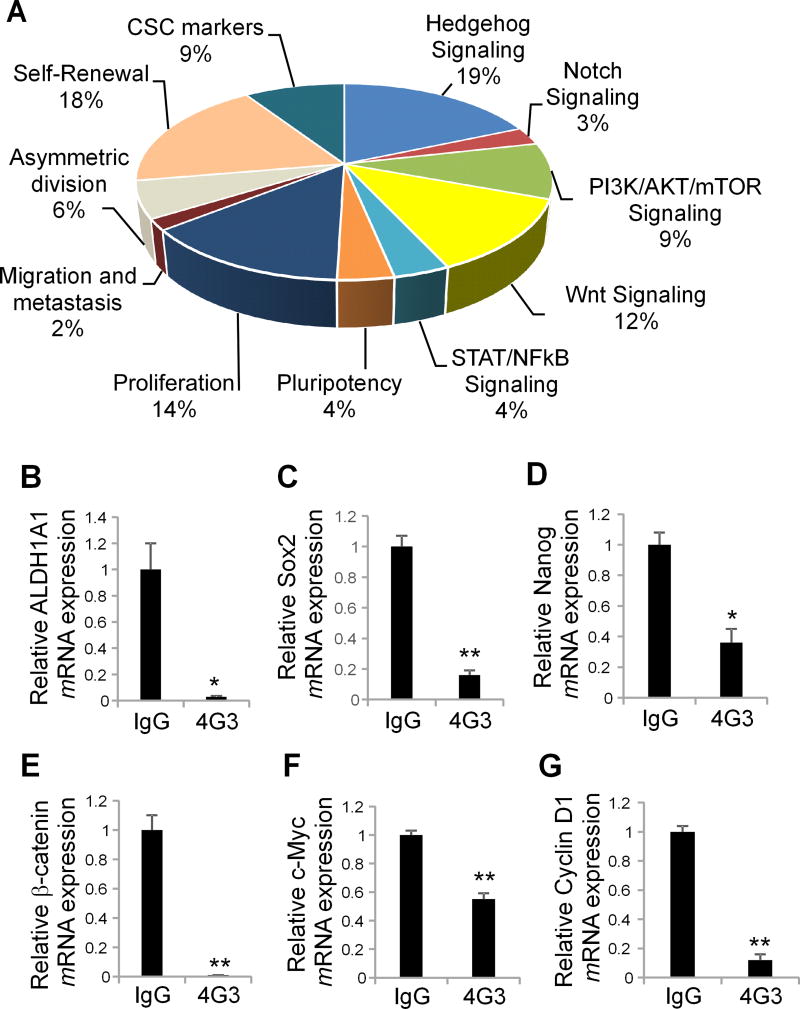
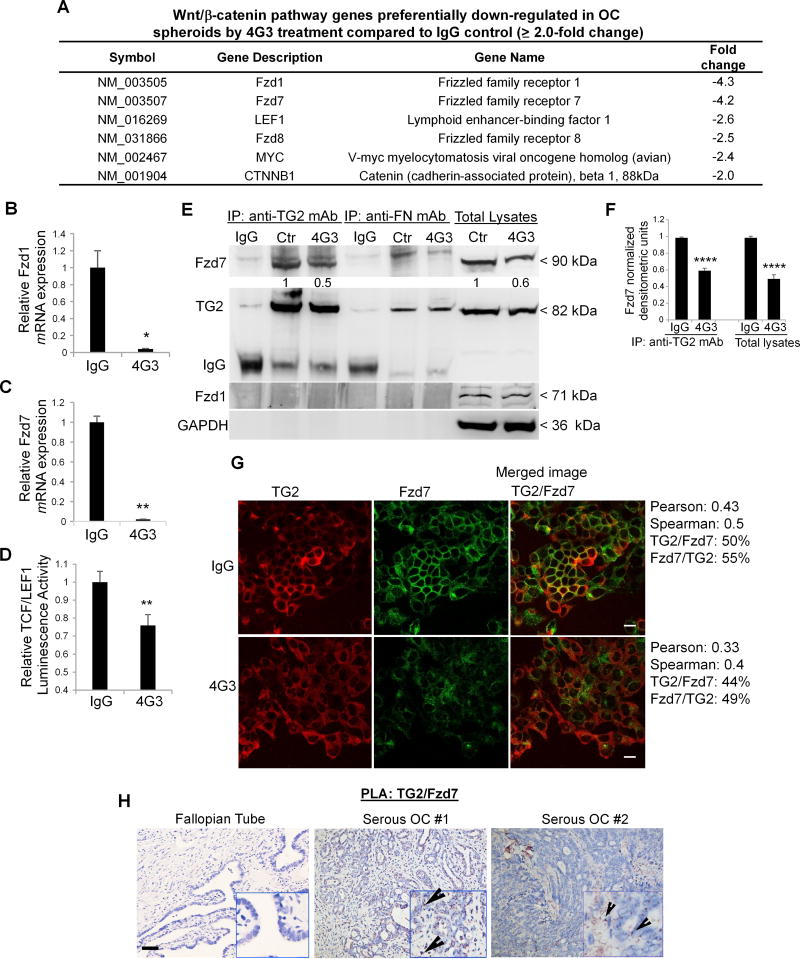
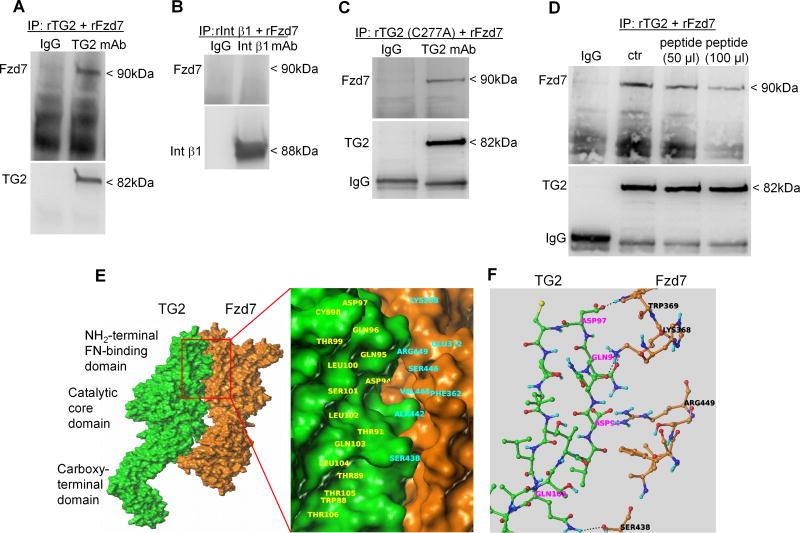
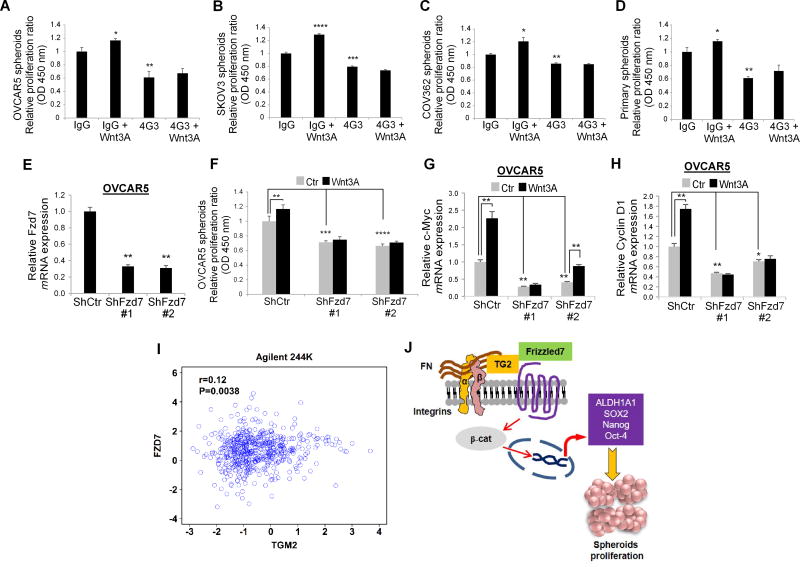
Cancer progression and recurrence are linked to a rare population of cancer stem cells (CSC). Here, we hypothesized that interactions with the extracellular matrix drive CSC proliferation and tumor-initiating capacity and investigated the functions of scaffold protein tissue transglutaminase (TG2) in ovarian CSC. Complexes formed by TG2, fibronectin (FN), and integrin β1 were enriched in ovarian CSC and detectable in tumors. A function-inhibiting antibody against the TG2 FN-binding domain suppressed complex formation, CSC proliferation as spheroids, tumor-initiating capacity, and stemness-associated Wnt/β-catenin signaling. Disruption of the interaction between TG2 and FN also blocked spheroid formation and the response to Wnt ligands. TG2 and the Wnt receptor Frizzled 7 (Fzd7) form a complex in cancer cells and tumors, leading to Wnt pathway activation. Protein docking and peptide inhibition demonstrate that the interaction between TG2 and Fzd7 overlaps with the FN-binding domain of TG2. These results support a new function of TG2 in ovarian CSC, linked to spheroid proliferation and tumor-initiating capacity and mediated through direct interactions with Fzd7. We propose this complex as a new stem cell target.Significance: These findings reveal a new mechanism by which ovarian CSCs interact with the tumor microenvironment, promoting cell proliferation and tumor initiation. Cancer Res; 78(11); 2990-3001. ©2018 AACR.


Conflict of interest statement

Conflict of Interest: None

Figures

Figure 1
Figure 1. Ovarian CSCs express high levels of TG2, Integrin β1, and FN1
A–B. TG2, integrin β1 (ITGB1), and FN1 mRNA levels measured by quantitative real-time PCR in ALDH+/CD133+ vs. ALDH/CD133 isolated from human ovarian cancer OVCAR5 and COV362 cells. (N ≥ 3; * P < 0.05, ** P < 0.01). C–D. Expression of TG2, integrin β1 (ITGB1), and FN1 in OVCAR5 and COV362 cells grown as monolayers or spheroids under low adherence conditions. (N ≥ 3; * P < 0.05, ** P < 0.01). E. Western blotting shows TG2, integrin β1, and FN expression levels in OVCAR5, COV362, and SKOV3 grown as monolayers (m) and spheroids (s). Densitometry quantifies TG2, integrin β1, and FN expression levels normalized for GAPDH. F. Western blot measured TG2 expression levels in OVCA432 cells stably transduced with non-targeting ShRNA vector control (Sh-Ctr) compared to pool of ShRNA targeting TG2 (Sh-TG2). G. Flow cytometry measures ALDEFLUOR-FITC+/CD133-APC+ cells in OVCA432 cells transduced with ShCtr empty vector compared with TG2 knock down (Sh-TG2). DEAB/APC-Isotype treated cells serve as negative controls. Measurements were performed in three replicates.
Figure 2
Figure 2. TG2/FN/Integrin β1 form a complex in OC spheroids
A. IF staining for TG2 (Alexa Fluor 488, green) and integrin β1 (Alexa Fluor 568, red) in OC spheroids and monolayers. Protein co-localization is identified by yellow spectra on merged images. B. Quantification of co-localized proteins was calculated by volume area of green over red spectra by using Metamorph software (N ≥ 3; ****P<0.0001). C. IF staining for TG2 (Alexa Fluor 488, green) and FN (Alexa Fluor 568, red) in OC monolayers and spheroids. D. Quantification of co-localized proteins was calculated by volume area of green over red spectra (N ≥ 3; **P<0.01). E. TG2/integrin β1 co-localization detected by PLA in human ovarian tumors, normal surface ovarian and fallopian tube epithelium, included on a multi-tissue array. Representative images are shown (×200 magnification). Bar corresponds to 10µm. F–G. Correlation between TG2 and integrin β1 (ITGB1) mRNA expression levels (R=0.23; P<0.0001) and between TG2 and FN1 mRNA expression levels (R=0.39; P<0.0001) in the ovarian cancer Agilent 244K TCGA database. H. Overall survival curves generated using the Kaplan-Meier plot for tumors expressing high levels of TG2 and of ITGB1 vs. those expressing low levels of TG2 and of ITGB1 vs. all others in the Agilent 244K TCGA database (P=0.00652). The median survival time for each group is presented in brackets. The numbers of patients at risk in low, high and others mRNA expression groups at different time points are presented at the bottom of the graph.
Figure 3
Figure 3. TG2/FN/Integrin β1 complex regulates spheroids proliferation and tumor initiating capacity
A. Graphical representation of the epitope targeted by the 4G3 mAb overlapping with the FN-binding domain of TG2 (amino acids 1-165). B. Co-IP with anti-TG2 and anti-FN mAbs of cell lysates from OVCAR5 spheroids treated with 4G3 (10µg/ml) for 6 days. Western blotting was performed by using anti-TG2 and FN monoclonal antibodies. C. Densitometric analysis results are shown as means ± SEM. (N= 3; *P<0.05, **P<0.01). D–F. CCK-8 assay quantifies proliferation of spheroids derived from OC cell lines and primary cells treated with inhibitory mAbs directed against the FN-binding domain of TG2 (4G3), and integrin β1 (clone P5D2) (N= 8; *P< 0.05, **P< 0.01, ****P< 0.0001). G–H. Tumor weights and volumes derived from ALDH+/CD133+ sorted from OVCAR5 cells and treated with 4G3 or IgG control and injected sq in nude mice, as described (N= 5; **P< 0.01). I. Time to tumor formation for 10,000 ALDH+/CD133+ cells pre-treated with IgG or 4G3, grown as spheroids for 6 days, and injected sq in nude mice. J. Spheroid morphology (left panel) and proliferation assay (right panel) of cells isolated from xenografts and grown ex vivo. (N= 3; ***P< 0.001).
Figure 4
Figure 4. TG2/FN/Integrin β1 complex regulates β-catenin activation
A. Expression levels of stemness associated genes in 4G3 compared to control (IgG) treated OVCAR5 cells grown as spheroids were quantified by RT2 Profiler PCR array. Pie chart analysis illustrates the fold-changes (≥2.0) of downregulated genes (% of total) for each represented pathway in control vs treated spheres. B–D. Quantitative RT-PCR for ALDH1A1, Sox2, and Nanog mRNA expression levels in 4G3 compared to control (IgG) treated OVCAR5 spheroids. E–G. Quantitative RT-PCR for β-catenin, c-Myc, and cyclin D1 in 4G3 compared to control (IgG) treated OVCAR5 spheroids (N ≥ 6; *P< 0.05, **P< 0.01).
Figure 5
Figure 5. TG2 and Fzd7 form a complex in OC cells
A. List of Wnt/β-catenin pathway genes down-regulated in OVCAR5 spheroids by 4G3 treatment compared to IgG control (≥2.0-fold change). B–C. Quantitative RT-PCR for Fzd1 and Fzd7 in OVCAR5 spheroids (N ≥ 6; *P< 0.05, **P< 0.01). D. OVCAR5 cells were co-transfected with TCF/LEF1 luciferase reporter and Renilla control plasmid, prior to treatment with 4G3 or IgG (control) and plated as spheroids. Luciferase signal relative to Renilla activity is expressed as fold increase (N ≥ 6; **P< 0.01). E. Co-IP with anti-TG2 and anti-FN mAbs of cell lysates from OVCAR5 spheroids treated with 4G3. Western blotting was performed by using anti-Fzd7, Fzd1, and GAPDH antibodies. F. Densitometric analysis results are shown as means ± SEM. (N=3; ****P<0.0001). G. IF staining for TG2 (red) and Fzd7 (green) in control and 4G3 treated OC cell lines (×400 magnification). Quantification of co-localized proteins was calculated by volume area of green over red spectra in IgG control (N ≥ 3; Spearman’s rank correlation= 0.5) vs 4G3 treated cells (N ≥ 3; Spearman’s rank correlation= 0.40). H. TG2/Fzd7 co-localization detected by PLA in human ovarian tumors included on a multi-tissue array and in normal fallopian tube epithelium. Representative images are shown (×200 magnification). Bar corresponds to 10µm.
Fig 6
Fig 6. TG2 forms a complex with Fzd7 in OC spheroids
A. Co-IP with anti-TG2 mAb and western blotting for TG2 and Fzd7 using full length recombinant TG2 and Fzd7. B. Co-IP with anti- integrin β1 mAb and western blotting for integrin β1 and Fzd7 using recombinant integrin β1 and Fzd7. C. Co-IP with anti-TG2 mAb and western blotting for TG2 and Fzd7 using recombinant mutant TG2 (C277A) and Fzd7. D. Co-IP with anti-TG2 mAb and western blotting for TG2 and Fzd7 using recombinant TG2 and Fzd7 in the presence of different concentrations of a synthetic peptide 81DAVEEGDWTATVVDQQDCTLSLQLTTPANA110. E. Putative poses for protein-protein interaction were identified by using the crystal structure of TG2 (2Q3Z.pdb) available in the protein database and the virtual structure of Fzd7 obtained through homology modeling. F. Proposed interacting amino acids residues for TG2 and Fzd7.
Figure 7
Figure 7. TG2/Fzd7 direct interaction regulates spheroid proliferation
A–D. Proliferation assay measured the number of cells growing as spheroids derived from OC cell lines (OVCAR5, COV362, and SKOV3) and from primary OC cells derived from malignant ascites after treatment with 4G3 and/or Wnt3A for 6 days compared with IgG controls. (N ≥ 3; *P< 0.05, **P< 0.01, ***P<0.001, ****P< 0.0001). E. Q-RT-PCR for Fzd7 in OVCAR5 cells stably transduced with scrambled- or Fzd7-targeting ShRNA (N ≥ 3). F. Spheroids proliferation assay in OVCAR5 cells stably transduced with scrambled- or Fzd7-targeting ShRNA and treated with Wnt3A (150ng/mL) or control. (N ≥ 3). G–H. Q-RT-PCR for c-Myc and cyclin D1 in OVCAR5 cells transduced with scrambled vs. Fzd7-targeting ShRNA and treated with Wnt3A (150ng/mL) or control. (N ≥ 3). I. Correlation between TG2 and Fzd7, mRNA expression levels (R= 0.12, P= 0.0038) in the ovarian cancer Agilent 244K TCGA database. J. Proposed mechanism by which TG2/FN complex interacts with Fzd7 and promotes Wnt/β-catenin-mediated cancer stemness.

Similar articles

Cited by

References

    1. Siegel R, Ma J, Zou Z, Jemal A. Cancer statistics, 2014. CA Cancer J Clin. 2014;64:9–29. - PubMed
    1. Lengyel E. Ovarian cancer development and metastasis. Am J Pathol. 2010;177:1053–64. - PMC - PubMed
    1. Matte I, Lane D, Laplante C, Rancourt C, Piche A. Profiling of cytokines in human epithelial ovarian cancer ascites. Am J Cancer Res. 2012;2:566–80. - PMC - PubMed
    1. Mills GB, May C, Hill M, Campbell S, Shaw P, Marks A. Ascitic fluid from human ovarian cancer patients contains growth factors necessary for intraperitoneal growth of human ovarian adenocarcinoma cells. J Clin Invest. 1990;86:851–5. - PMC - PubMed
    1. Burleson KM, Casey RC, Skubitz KM, Pambuccian SE, Oegema TR, Jr, Skubitz AP. Ovarian carcinoma ascites spheroids adhere to extracellular matrix components and mesothelial cell monolayers. Gynecol Oncol. 2004;93:170–81. - PubMed

Publication types

MeSH terms