. 2018 Jun;24(6):787-802.
doi: 10.1261/rna.062752.117. Epub 2018 Mar 6.

MicroRNA duplication accelerates the recruitment of new targets during vertebrate evolution

Affiliations

MicroRNA duplication accelerates the recruitment of new targets during vertebrate evolution

Junjie Luo et al. RNA. 2018 Jun.

Abstract

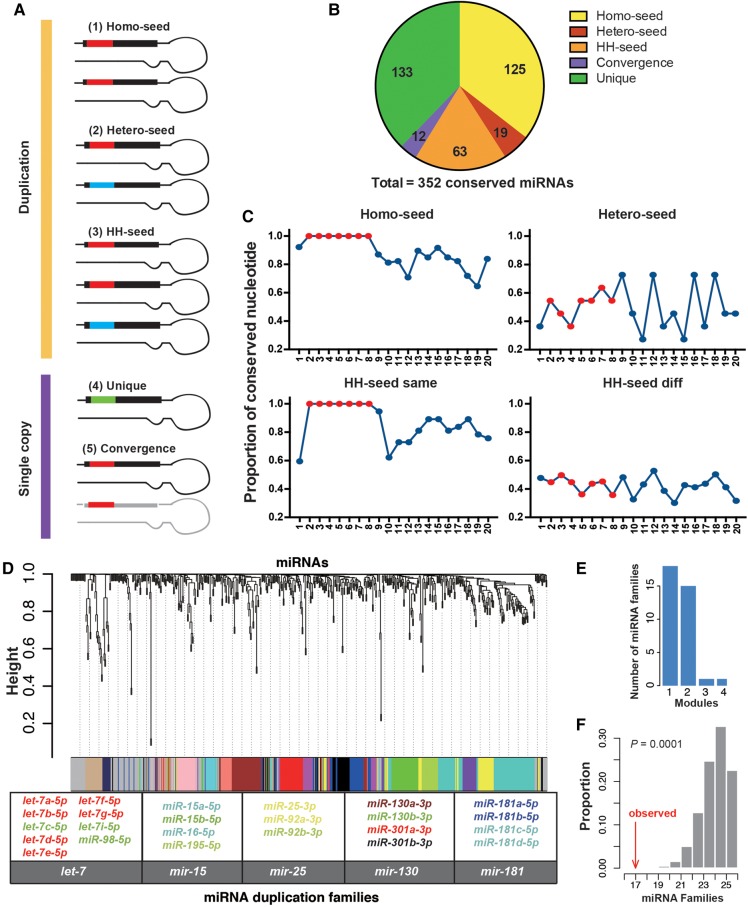
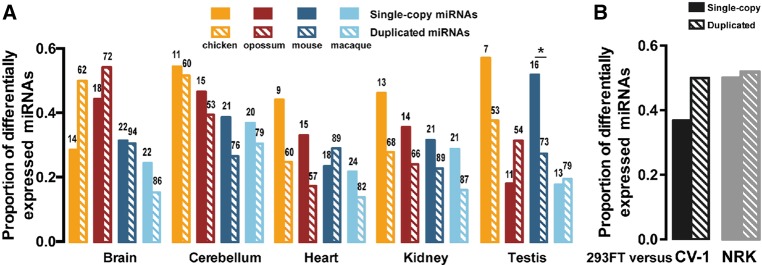
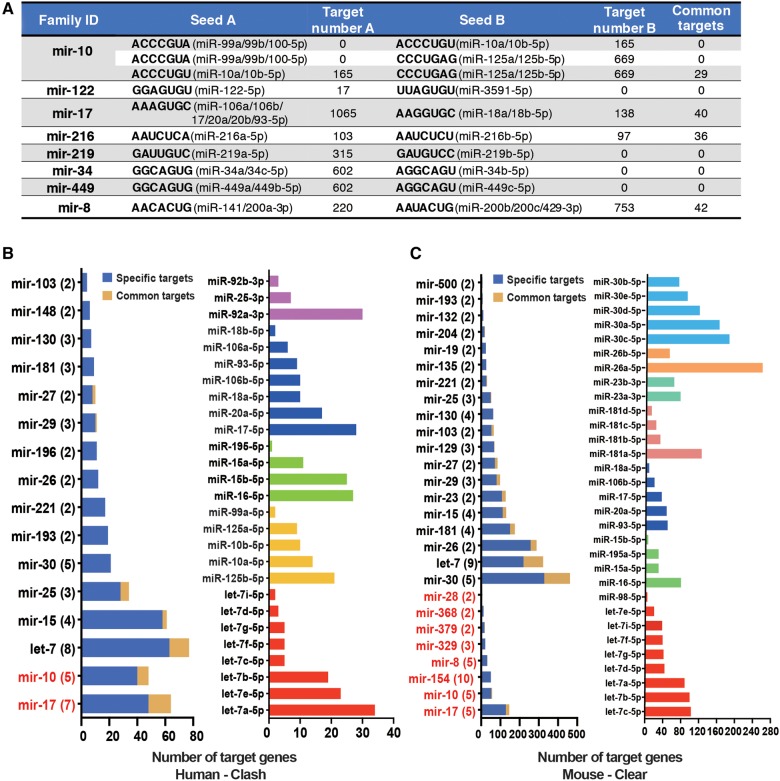
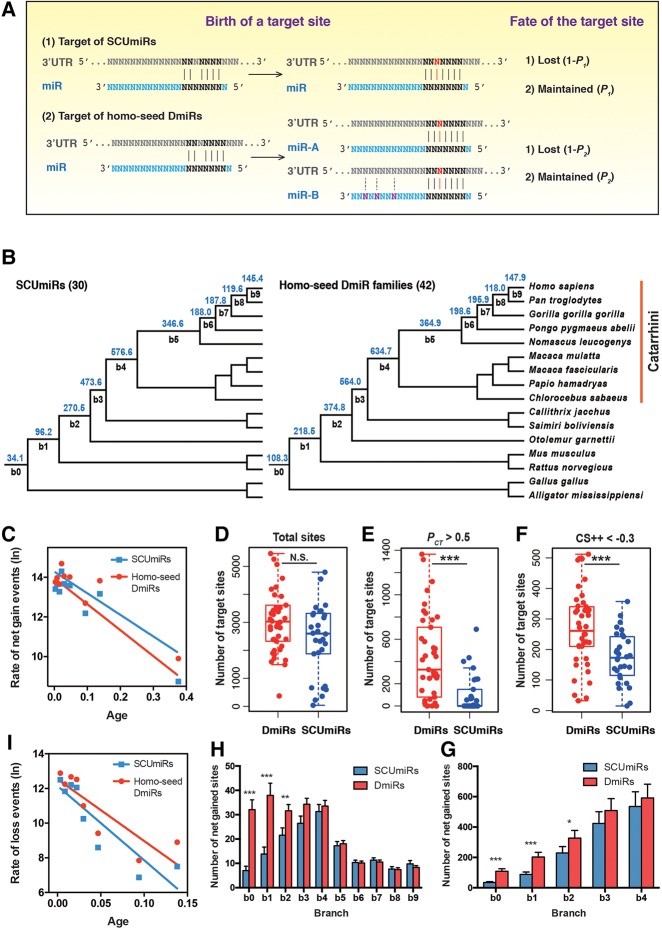
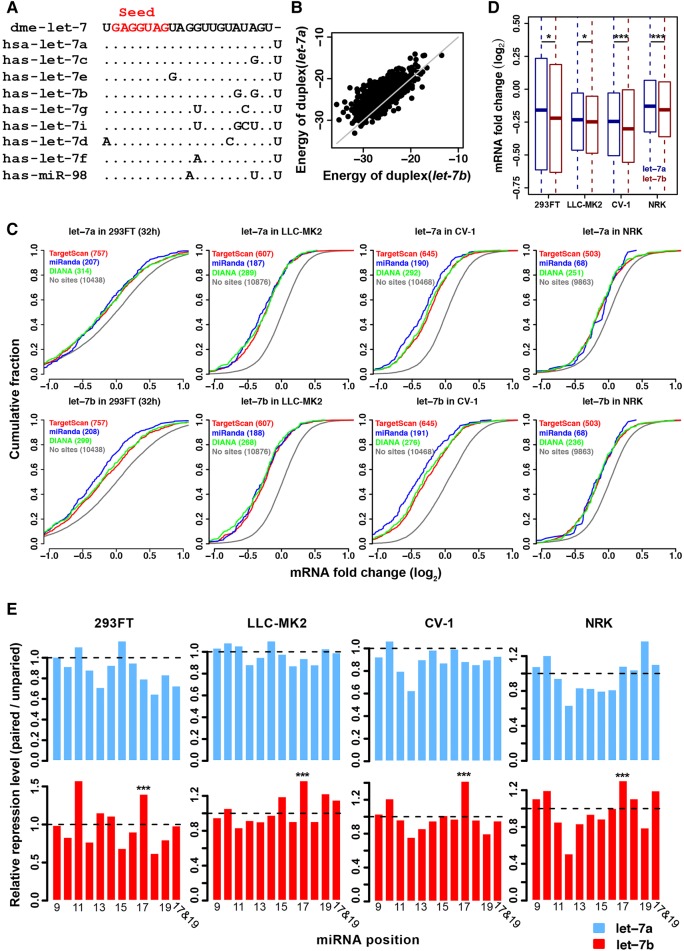
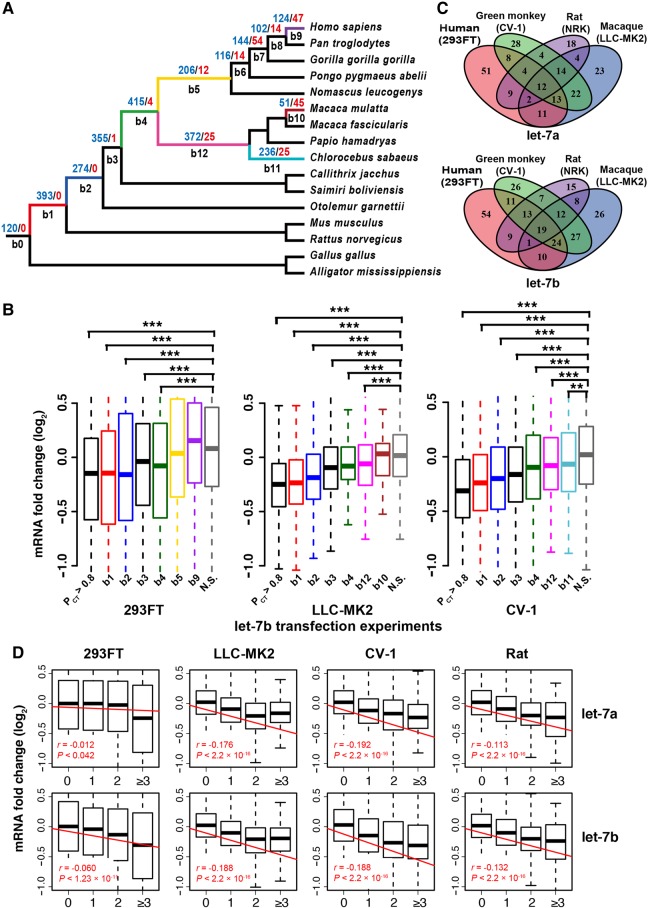
The repertoire of miRNAs has considerably expanded during metazoan evolution, and duplication is an important mechanism for generating new functional miRNAs. However, relatively little is known about the functional divergence between paralogous miRNAs and the possible coevolution between duplicated miRNAs and the genomic contexts. By systematically examining small RNA expression profiles across various human tissues and interrogating the publicly available miRNA:mRNA pairing chimeras, we found that changes in expression patterns and targeting preferences are widespread for duplicated miRNAs in vertebrates. Both the empirical interactions and target predictions suggest that evolutionarily conserved homo-seed duplicated miRNAs pair with significantly higher numbers of target sites compared to the single-copy miRNAs. Our birth-and-death evolutionary analysis revealed that the new target sites of miRNAs experienced frequent gains and losses during function development. Our results suggest that a newly emerged target site has a higher probability to be functional and maintained by natural selection if it is paired to a seed shared by multiple paralogous miRNAs rather than being paired to a single-copy miRNA. We experimentally verified the divergence in target repression between two paralogous miRNAs by transfecting let-7a and let-7b mimics into kidney-derived cell lines of four mammalian species and measuring the resulting transcriptome alterations by extensive high-throughput sequencing. Our results also suggest that the gains and losses of let-7 target sites might be associated with the evolution of repressiveness of let-7 across mammalian species.

Keywords: birth-and-death; expression divergence; let-7 family; microRNA duplication; target repression; target site evolution.


Figures

FIGURE 1.
FIGURE 1.
The divergence in sequences and expression patterns between duplicated miRNAs. (A) The classification of human miRNAs that are evolutionarily conserved. Based on the seed sequences of the paralogous miRNAs, the DmiRs are divided into three categories: (1) the homo-seed families; (2) the hetero-seed families; and (3) the homo–hetero-seed (HH-seed) families. For the single-copy mRNAs, they can have seeds identical to other miRNAs that do not have sequence similarity in the precursors due to convergent evolution (Convergence), or they have unique seeds (SCUmiRs). (B) The numbers of miRNA precursors in each of the five categories as described in A. (C) The proportion of nucleotides that are identical between two paralogous miRNAs (y-axis) along the position (x-axis) of the mature miRNAs. On each position, the proportion of the pairwise comparisons that have the same nucleotides out of the total number of pairwise comparisons (y-axis) is given. “HH-seed same,” the paralogous miRNAs that share the same seeds in the HH-seed families; “HH-seed diff,” the paralogous miRNAs that have different seeds in the HH-seed families. Positions 2–8 are shown in red. (D) Hierarchical clustering of 574 miRNAs from 181 nonredundant human tissues/cell lines using WGCNA. The color row below the dendrogram shows the module assignment for each miRNA. The histogram shows the number of miRNA families (y-axis) that had paralogous miRNAs assigned to a single (1, x-axis) module or multiple (2, 3, or 4, x-axis) modules. Five representative miRNA families that had paralogs assigned to at least two different modules are given, with each miRNA member labeled in the same color as the module containing that miRNA. (E) The number of miRNA families (y-axis) that had broadly conserved paralogs assigned to different numbers of modules (x-axis). (F) The observed number of miRNA families that had paralogous copies assigned to at least two different expression modules (the red arrow) and the distribution of the simulated numbers (x-axis) obtained by randomly permuting the miRNA: module assignments for 10,000 replicates (the mean is 25, and 95% CI is [22, 26]).
FIGURE 2.
FIGURE 2.
The proportions of duplicated and single-copy miRNAs that are differentially expressed by at least fourfold change (y-axis) between humans and other vertebrate species. (A) The comparisons in five tissues between human and macaque, mouse, opossum, or chicken. (B) The comparisons between human (293FT) and green monkey (CV-1) or between human and rat (NRK) cell lines. The number above each box represents the number of single-copy or duplicated miRNAs that are broadly conserved in vertebrates and expressed in both humans and the other species.
FIGURE 3.
FIGURE 3.
Divergence in target pairing between the paralogous miRNAs. (A) The numbers of target sites shared between two seeds (common targets) in the hetero-seed and HH-seed miRNA families (target sites were predicted with TargetScan PCT > 0.5). The broadly conserved miRNAs that had the specified seeds are shown. (B) The number of canonical target sites in 3′ UTRs (seed pairing) bound by at least one member of a miRNA family in the CLASH data set (x-axis). “Specific targets”: the target is only bound by one paralogous miRNA; “Common targets”: the target genes that were targeted by at least two paralogous miRNAs that were expressed. (Left panel) The HH-seed family is indicated in red; the number of paralogous miRNAs in each family that were expressed in the CLASH data set is given in parentheses. (Right panel) The number of canonical target sites bound by the paralogs in five representative miRNA families. (C) The number of canonical target sites in 3′ UTRs bound by at least one member of a miRNA family in the CLEAR data set (x-axis). The figure setting is the same as in B.
FIGURE 4.
FIGURE 4.
The evolutionary dynamics of canonic target sites for the SCUmiRs and homo-seed DmiRs. (A) A scheme describing how the evolutionary dynamics are different for targets of SCUmiRs versus homo-seed DmiRs. A point mutation (red) in the 3′ UTR generates a new target site that is perfectly paired to the seed of a miRNA. The probability that the target site becomes functional and maintained by natural selection during evolution is P1 if it is paired to the seed of SCUmiR, and P2 if it is paired to the seed of homo-seed DmiRs. Accordingly, the probability that the target site is lost during evolution is 1 − P1 and 1 − P2, respectively. We postulate that P2 would be higher than P1 based on the following considerations: (1) The nucleotides outside the seed regions of the homo-seed DmiRs might have more flexibility to optimize the miRNA: target pairing; and (2) the expression divergence would cause the duplicated copies of the homo-seed DmiRs to be exposed to more mRNAs in more spatial and temporal environments, which might also increase the chance for a new target site to develop function. Based on this model, during long-term evolution, the seeds of the homo-seed DmiRs would have higher numbers of functional target sites than those of the SCUmiRs. (B) The average number of net-gained target sites per seed in the branches leading to extant humans for the broadly conserved miRNAs that originated before the split of birds and mammals (30 SCUmiRs, left; and 42 homo-seed DmiR families, right). The target sites were predicted with TargetScan with the requirement of perfect seed pairing (7mer-m8 and 8mer). b0–b9 represents the branches leading to extant humans. The number of target sites in b0 is the target sites (per seed) that are ancient and conserved in all 16 species. Branch length is not scaled. (C) Correlation between the age of a branch (x-axis) and the rate of net gained target sites in that branch (y-axis). The age of each branch is calculated based on the middle point of the branch length and the offspring branches, if applicable. The rate is defined as the number of target sites gained per evolutionary unit (mutations per nucleotide per generation). (D) The boxplot of canonical target sites of the homo-seed DmiRs and SCUmiRs (N.S., not significant). (E) The seed of a homo-seed DmiR family pairs a significantly higher number of conserved target sites (PCT > 0.5) than that of a SCUmiR; (***) P < 0.001. (F) The seed of a homo-seed DmiR family pairs a significantly higher number of optimized target sites (context++ score < −0.3) than that of a SCUmiR; (***) P < 0.001. (G) The average numbers of target sites that originated in the ancient branches (b1, b2, b3, and b4) and conserved in extant humans and at least seven other Catarrhini species (hominoids and old world monkeys, see Fig. 4B). For each branch, a WMW test was used to test whether there is a significant difference in the numbers of target sites for a homo-seed DmiR family and a SCUmiR (*) P < 0.05; (***) P < 0.001. The number of target sites in b0 is the target sites (per seed) that are ancient and conserved in all 16 species. The bars represent the standard errors. (H) The number of the net-gained target sites in each branch (b1–b9) leading to extant human and that are located in the optimized genomic contexts for miRNA targeting (context++ score < −0.3). For each branch, a WMW test was used to test whether there is a significant difference in the numbers of target sites for a homo-seed DmiR family and a SCUmiR; (**) P < 0.01, (***) P < 0.001. The number of target sites in b0 is the target sites (per seed) that are ancient and conserved in all 16 species. The bars represent the standard errors. (I) Correlation between the age of a branch (x-axis) and the loss rate of putative target sites lost in that branch.
FIGURE 5.
FIGURE 5.
The repressive effect mediated by let-7a and let-7b in transfection experiments. (A) Sequence alignment of human let-7 family miRNAs. The seed region (positions 2–8) is shown in red. let-7 of D. melanogaster was used as an outgroup. (B) The two A > G substitutions in let-7b enable let-7b to exert stronger binding affinities (lower energy, kcal/mol) to the target sites than let-7a. (C) Cumulative distribution of log2 fold changes in mRNA levels (x-axis) after transfecting let-7a or let-7b into human, macaque, green monkey, or rat cell lines. The target genes (with canonical sites in the 3′ UTRs) of let-7a and let-7b were predicted by TargetScan with a PCT > 0.8 (red), miRanda with a mirSVR score < −0.8 (blue), or DIANA with a threshold score > 0.5 (green). The mRNAs without any site complementary to the seed sequence of let-7a/b (controls, gray) were used as controls. The log2 fold change of the predicted target sites is significantly lower compared to the control mRNAs in each comparison (P < 0.0001 in each comparison, Kolmogorov–Smirnov test). (D) let-7b (purple) exerted stronger repressive effects on the canonical target genes than let-7a (blue) in the cellular transfection experiments ([*] P < 0.05; [***] P < 0.001; paired t-tests). The target genes from different sources in C were pooled. (E) The ratio of median log2 fold change for target genes (y-axis) that have canonical sites paired at the indicated position of let-7a (upper panel) or let-7b (lower panel) relative to the target genes not paired at that position. Pairing at position 17 of let-7b is associated with significantly stronger repressive efficiencies compared to the other conserved canonical sites, but such a pattern does not exist for let-7a; ([***] P < 0.001, Fisher's exact test).
FIGURE 6.
FIGURE 6.
Birth and death of let-7 target sites during mammalian evolution and the contributions to the evolution of transcriptomes. (A) The gains and losses of canonical let-7a/b target sites in the branches leading to extant primates. The numbers of gain and loss events are in blue and red, respectively. The number of target sites in b0 is the target sites that are ancient and conserved in all 16 species. (B) Changes in the mRNA abundance of genes with ancient or newly emerged target sites after transfecting let-7b into human, macaque, and green monkey cells. The target sites of let-7b predicted with PCT > 0.8 are also shown (these sites are not exclusive to sites in branches b1–b9 of Fig. 6A). The genes with target sites originating in a branch and maintained thereafter were used in the analysis. If a gene had multiple target sites of different ages, the gene was assigned to the most ancient class. N.S., nontarget sites. (C) Venn diagram showing only a small fraction of the evolutionarily conserved canonical target sites (TargetScan v7.0, PCT > 0.8) consistently mediated repression across the four species in the let-7a and let-7b experiments. The number of the significantly down-regulated genes after transfection is shown for each species. (D) Genes whose 3′ UTRs have higher numbers of canonical let-7a (upper) and let-7b (lower) target sites are more strongly repressed in the transfection experiments. Both the conserved and nonconserved target sites were considered. The raw Pearson's correlation coefficient r is shown for each experiment.

References

    1. Aboobaker AA, Tomancak P, Patel N, Rubin GM, Lai EC. 2005. Drosophila microRNAs exhibit diverse spatial expression patterns during embryonic development. Proc Natl Acad Sci 102: 18017–18022. - PMC - PubMed
    1. Agarwal V, Bell GW, Nam JW, Bartel DP. 2015. Predicting effective microRNA target sites in mammalian mRNAs. eLife 4: e05005. - PMC - PubMed
    1. Albalat R, Cañestro C. 2016. Evolution by gene loss. Nat Rev Genet 17: 379–391. - PubMed
    1. Anders S, Pyl PT, Huber W. 2015. HTSeqa Python framework to work with high-throughput sequencing data. Bioinformatics 31: 166–169. - PMC - PubMed
    1. Ason B, Darnell DK, Wittbrodt B, Berezikov E, Kloosterman WP, Wittbrodt J, Antin PB, Plasterk RH. 2006. Differences in vertebrate microRNA expression. Proc Natl Acad Sci 103: 14385–14389. - PMC - PubMed

Publication types

LinkOut - more resources