. 2018 Apr 2;215(4):1035-1045.
doi: 10.1084/jem.20180118. Epub 2018 Mar 6.

Irg1 expression in myeloid cells prevents immunopathology during M. tuberculosis infection

Affiliations

Irg1 expression in myeloid cells prevents immunopathology during M. tuberculosis infection

Sharmila Nair et al. J Exp Med. .

Abstract

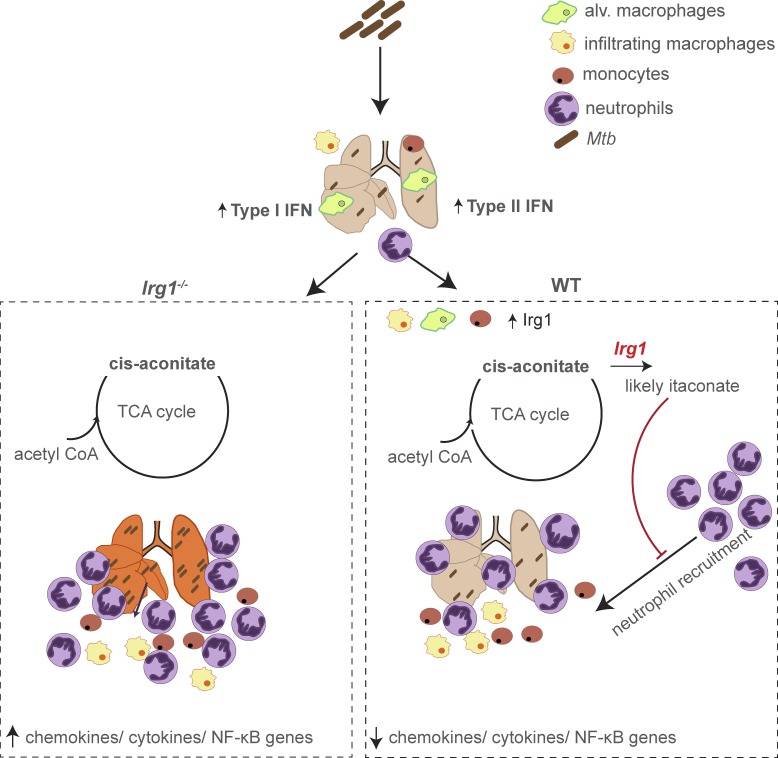
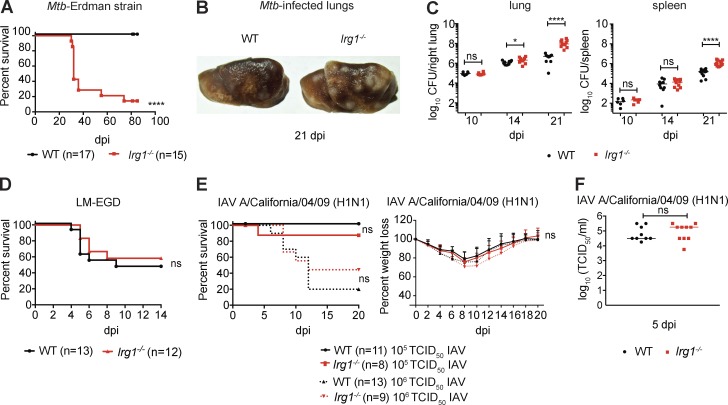
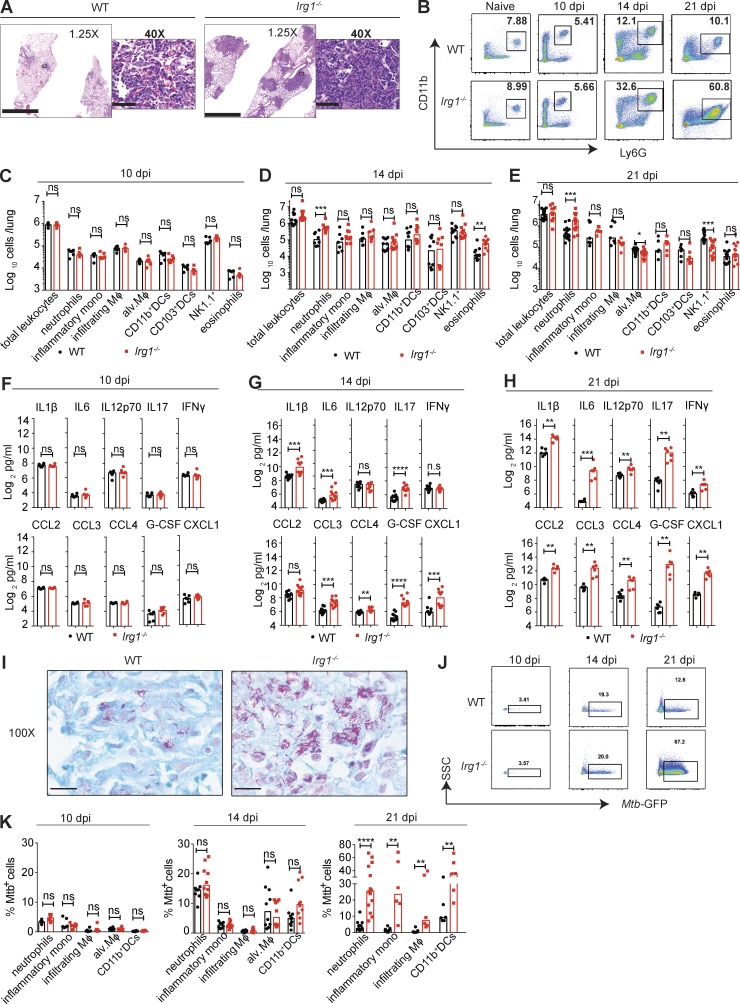
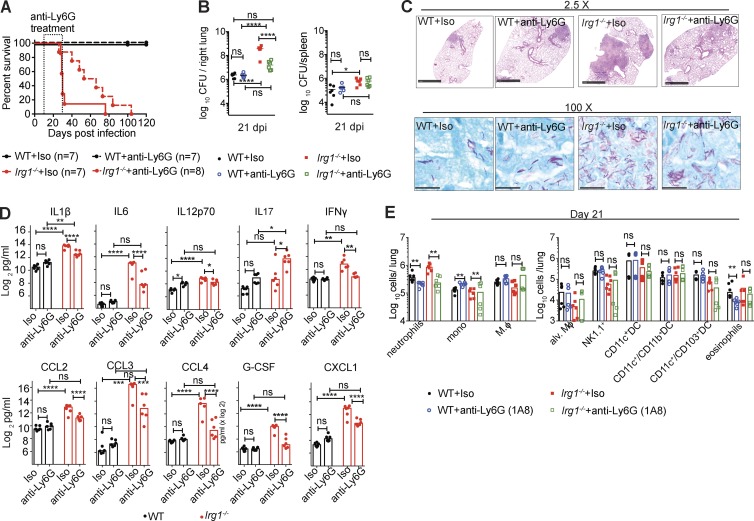
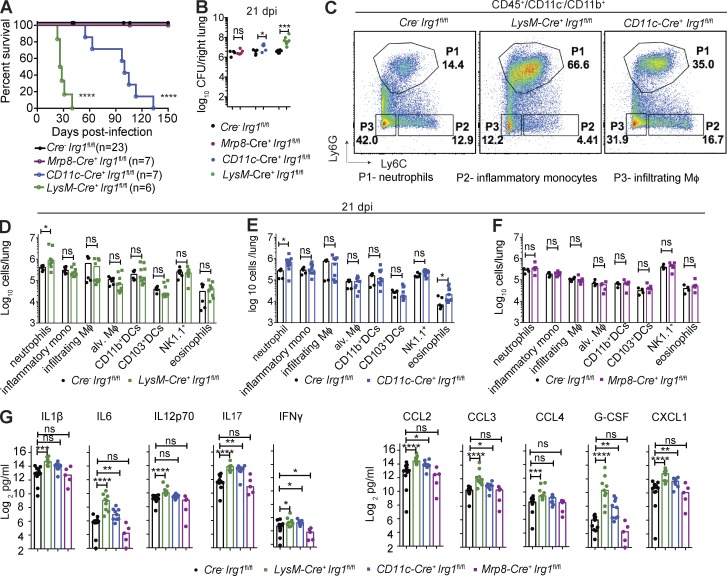
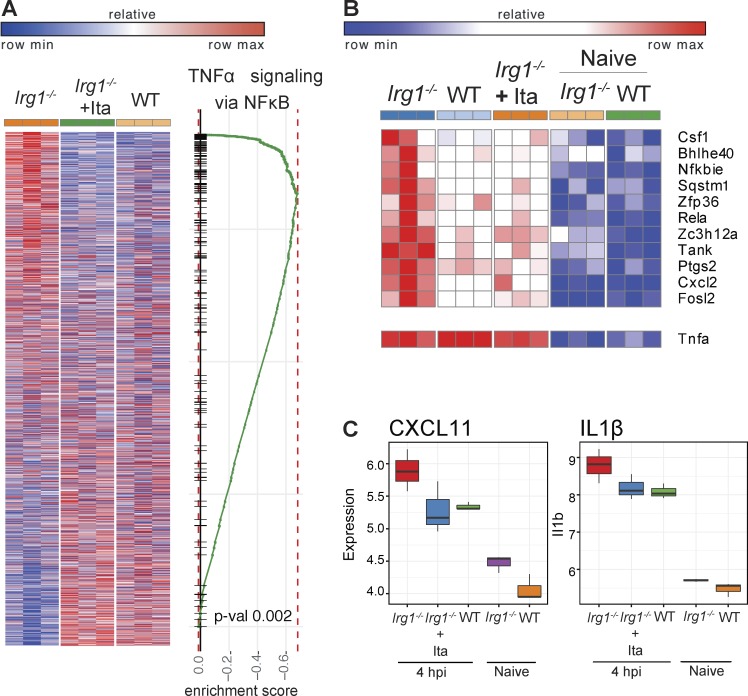
Immune-Responsive Gene 1 (Irg1) is a mitochondrial enzyme that produces itaconate under inflammatory conditions, principally in cells of myeloid lineage. Cell culture studies suggest that itaconate regulates inflammation through its inhibitory effects on cytokine and reactive oxygen species production. To evaluate the functions of Irg1 in vivo, we challenged wild-type (WT) and Irg1-/- mice with Mycobacterium tuberculosis (Mtb) and monitored disease progression. Irg1-/-, but not WT, mice succumbed rapidly to Mtb, and mortality was associated with increased infection, inflammation, and pathology. Infection of LysM-Cre Irg1fl/fl, Mrp8-Cre Irg1fl/fl, and CD11c-Cre Irg1fl/fl conditional knockout mice along with neutrophil depletion experiments revealed a role for Irg1 in LysM+ myeloid cells in preventing neutrophil-mediated immunopathology and disease. RNA sequencing analyses suggest that Irg1 and its production of itaconate temper Mtb-induced inflammatory responses in myeloid cells at the transcriptional level. Thus, an Irg1 regulatory axis modulates inflammation to curtail Mtb-induced lung disease.


Figures

None
Graphical abstract
Figure 1.
Figure 1.
Irg1 is essential for host resistance to Mtb. (A–C) WT and Irg1−/− mice were infected with aerosolized Mtb. (A) Survival analysis. (B) Gross pathology of lungs at day 21. (C) Mtb burden (GFP+ Erdman strain) was measured at days 10 (n = 6), 14 (n = 10), and 21 (n = 11–12) after infection. (D) WT and Irg1−/− mice were inoculated intravenously with Listeria monocytogenes (LM) and monitored for survival (n = 12–13). (E and F) WT and Irg1−/− mice were infected intranasally with IAV and monitored for survival and weight loss (E), and lung viral burden at 5 dpi (F; n = 9–10). (A–F) All data are from at least two independent experiments. Statistical differences are indicated. (C, E [right], and F) Mann-Whitney test: *, P < 0.05; ****, P < 0.0001; ns, not significant. (A, D, and E [left]) Log-rank test. ns, not significant. Error bars designate SEM.
Figure 2.
Figure 2.
Irg1 modulates inflammatory responses in the lung after Mtb infection. Mice were infected with aerosolized Mtb-GFP. (A) Histopathology was visualized by H&E staining of lungs at 21 dpi. Images are representative of two independent experiments. Bars: 2.5 mm (1.25×); 50 µm (40×). (B) Flow cytometry plots for neutrophils as a percentage of total CD45+ cells in lungs before Mtb infection and at 10, 14, and 21 dpi. Data are representative of results from n = 6–15 mice depending on the time point. (C–E) Number of innate immune cell populations in lungs at 10 dpi (C; n = 6), 14 dpi (D; n = 10), and 21 dpi (E; n = 6–15). (F–H) Cytokine and chemokine levels in the Mtb-infected lungs at 10 dpi (F; n = 6), 14 dpi (G; n = 10), and 21 dpi (H; n = 6). (I) Acid-fast bacilli in Mtb-infected lungs at 21 dpi. Images are representative of two independent experiments. Bars, 10 µm. (J) Flow cytometry plots for Mtb-GFP+ neutrophils in lungs at 10, 14, and 21 dpi. SSC, side scatter. (K) The percentage of Mtb-GFP-positive cells in indicated cell types at 10 (n = 6), 14 (n = 8–10), and 21 (n = 6–15) dpi. All data are pooled from at least two independent experiments. (C–H and K) Bars indicate median values. Statistical differences were determined by Mann-Whitney test (*, P < 0.05; **, P < 0.01; ***, P < 0.001; ****, P < 0.0001; ns, not significant). Mφ, macrophages. See also Figs. S1 and S2.
Figure 3.
Figure 3.
Depletion of neutrophils enhances survival of Mtb-infected Irg1−/− mice. WT and Irg1−/− mice were infected with aerosolized Mtb and treated with anti-Ly6G or isotype control antibodies as described in the Materials and methods. (A) Survival analysis (n = 7–8). (B) Mtb burden in the lung at 21 dpi (n = 7–8). Lines indicate median values. (C) Lung histopathology and acid-fast bacilli at 21 dpi were visualized with H&E (top) and acid-fast (bottom) stains. Images are representative of two independent experiments. Bars: 1 mm (top); 100 µm (bottom). (D) Cytokine levels at 21 dpi (n = 6). (E) Innate immune cell populations in the lung at 21 dpi (n = 6). All data are pooled from two independent experiments. Statistical differences were determined via one-way ANOVA with Tukey’s correction (B and D) and Mann-Whitney test (E; *, P < 0.05; **, P < 0.01; ***, P < 0.001; ****, P < 0.0001; ns, not significant). See also Fig. S2.
Figure 4.
Figure 4.
Loss of Irg1 in myeloid cell subsets confers susceptibility to Mtb. Mice were infected with aerosolized Mtb. (A) Survival analysis of Cre Irg1fl/fl, Mrp8-Cre+ Irg1fl/fl, CD11c-Cre+ Irg1fl/fl, and LysM-Cre+ Irg1fl/fl mice (n = 6–23) after Mtb infection. (B) Mtb burden in lungs of Cre Irg1fl/fl (n = 15), Mrp8-Cre+ Irg1fl/fl (n = 5), CD11c-Cre+ Irg1fl/fl (n = 9), and LysM-Cre+ Irg1fl/fl (n = 9) mice at 21 dpi. Lines indicate median values. (C) Flow cytometry plots of lung neutrophils (P1), inflammatory monocytes (P2), and infiltrating macrophages (P3) as a percentage of the total CD45+ CD11cCD11b+ population in Cre Irg1fl/fl, LysM-Cre+ Irg1fl/fl, and CD11c-Cre+ Irg1fl/fl mice at 21 dpi. (D–F) Quantitation of myeloid cells in lungs of Cre Irg1fl/fl (n = 6) and LysM-Cre+ Irg1fl/fl (D; n = 9), Cre Irg1fl/fl (n = 5) and CD11c-Cre+ Irg1fl/fl (E; n = 9), and Cre Irg1fl/fl (n = 4) and Mrp8-Cre+ Irg1fl/fl (F; n = 5) mice at 21 dpi. Mφ, macrophages. (G) Cytokine levels at 21 dpi (n = 5–14). All data are pooled from at least two independent experiments. Bars indicate median values. Statistical differences were determined via log-rank test with a Bonferroni post-hoc correction for multiple comparisons (A; ****, P < 0.0001) and Mann-Whitney test (B and D–G; *, P < 0.05; **, P < 0.01; ***, P < 0.001; ****, P < 0.0001; ns, not-significant). See also Fig. S3.
Figure 5.
Figure 5.
Irg1 alters the transcriptional signature in Mtb-infected BMDMs. (A–C) Transcriptomic data from WT, Irg1−/−, and Irg1−/− + itaconate (Ita)–treated BMDMs infected with Mtb and analyzed at 4 h postinfection (hpi). (A) Heat map comparing the transcriptional changes that occur at 4 hpi in Irg1−/− BMDMs ± Ita and WT BMDMs (left). Genes that are up-regulated in WT BMDMs also are enriched in Irg1−/− + itaconate BMDMs at 4 hpi. Columns and rows show conditions and genes, respectively. Genes are ranked according to significance of differential expression and direction of change. Plot shows the running score for NF-κB gene set as the analysis moves down the ranked list (right). (B and C) Gene set enrichment analysis comparison for genes in NF-κB signaling (B) and inflammatory chemokine CXCL11 and IL1-β (C) between WT versus Irg1−/−, WT versus Irg1−/− + Ita, and Irg1−/− + Ita versus Irg1−/− BMDMs. Error bars designate SEM.

References

    1. Bloch H., and Segal W.. 1956. Biochemical differentiation of Mycobacterium tuberculosis grown in vivo and in vitro. J. Bacteriol. 72:132–141. - PMC - PubMed
    1. Coleman J.L., Brennan K., Ngo T., Balaji P., Graham R.M., and Smith N.J.. 2015. Rapid Knockout and Reporter Mouse Line Generation and Breeding Colony Establishment Using EUCOMM Conditional-Ready Embryonic Stem Cells: A Case Study. Front. Endocrinol. (Lausanne). 6:105. - PMC - PubMed
    1. Computer Technologies Laboratory 2016. quant3p. A set of scripts to 3′ RNA-seq quantification. Available at: https://github.com/ctlab/quant3p (Accessed February 27, 2018).
    1. Cooper A.M., Dalton D.K., Stewart T.A., Griffin J.P., Russell D.G., and Orme I.M.. 1993. Disseminated tuberculosis in interferon gamma gene-disrupted mice. J. Exp. Med. 178:2243–2247. 10.1084/jem.178.6.2243 - DOI - PMC - PubMed
    1. Degrandi D., Hoffmann R., Beuter-Gunia C., and Pfeffer K.. 2009. The proinflammatory cytokine-induced IRG1 protein associates with mitochondria. J. Interferon Cytokine Res. 29:55–68. 10.1089/jir.2008.0013 - DOI - PubMed

Publication types

MeSH terms