. 2018 Apr 2;215(4):1115-1133.
doi: 10.1084/jem.20171608. Epub 2018 Mar 6.

Unveiling skin macrophage dynamics explains both tattoo persistence and strenuous removal

Affiliations

Unveiling skin macrophage dynamics explains both tattoo persistence and strenuous removal

Anna Baranska et al. J Exp Med. .

Abstract

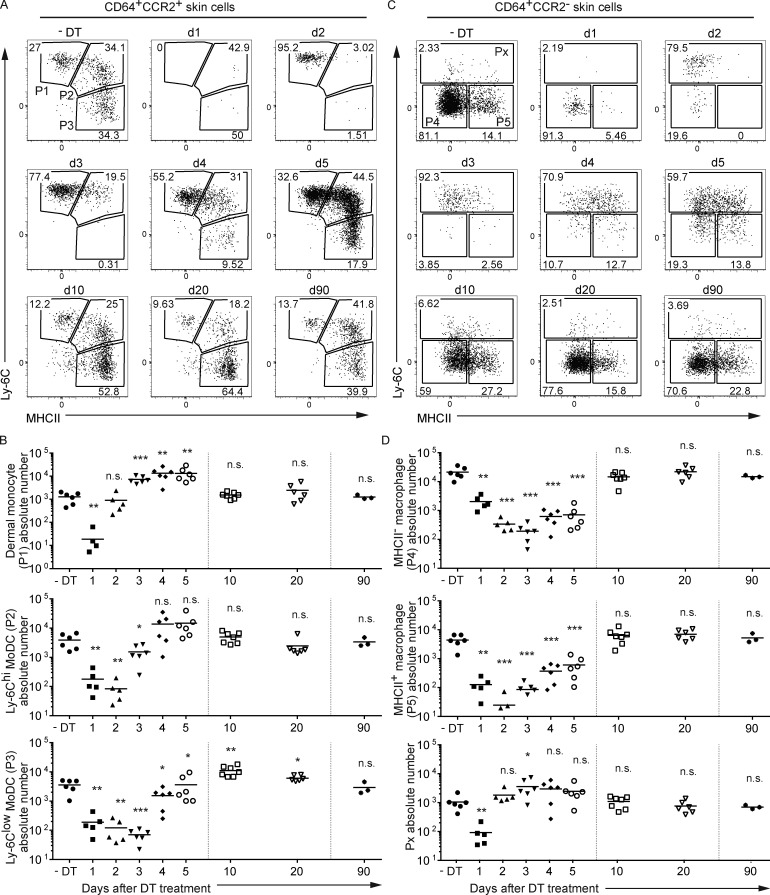
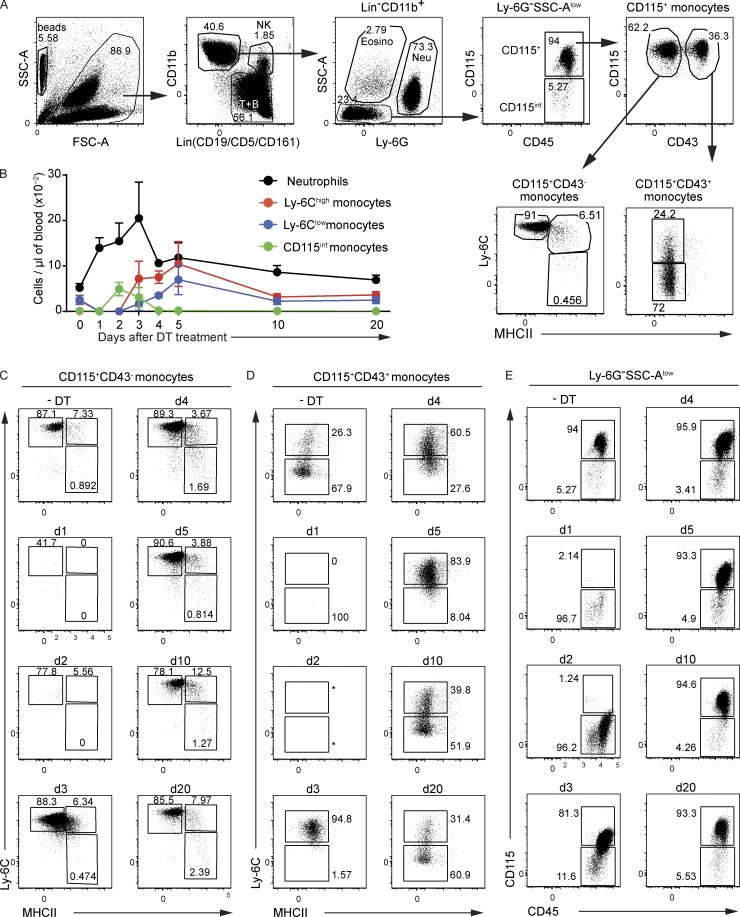
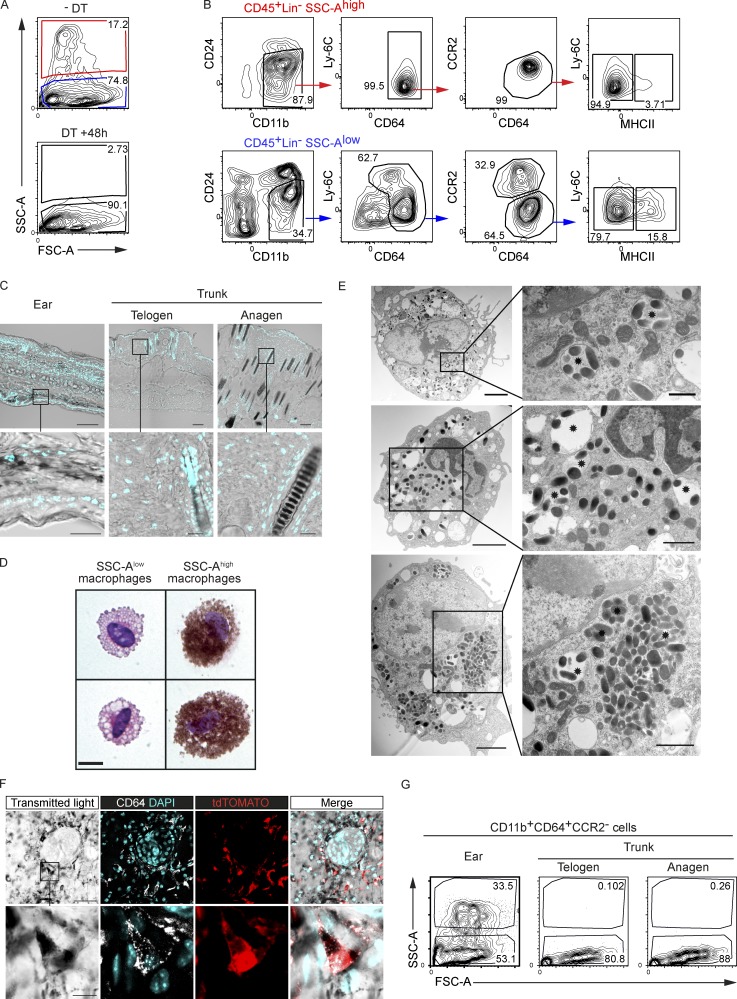
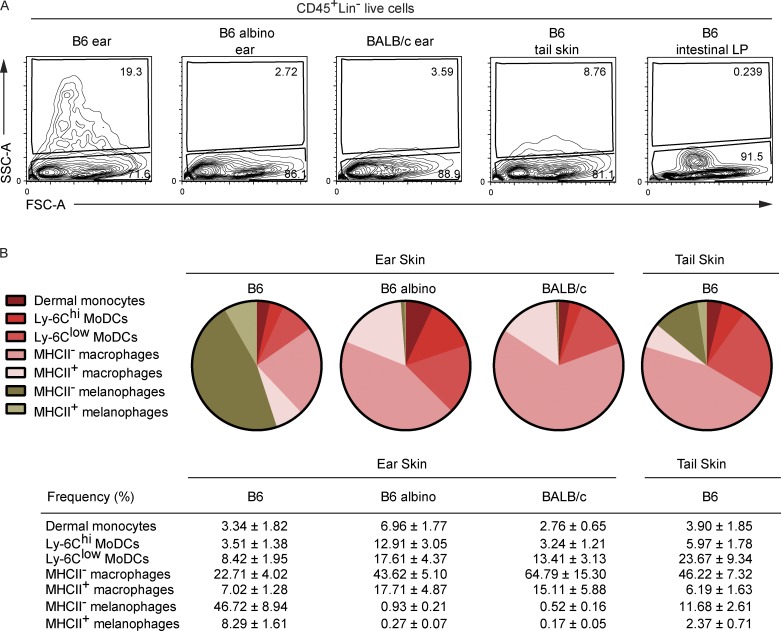
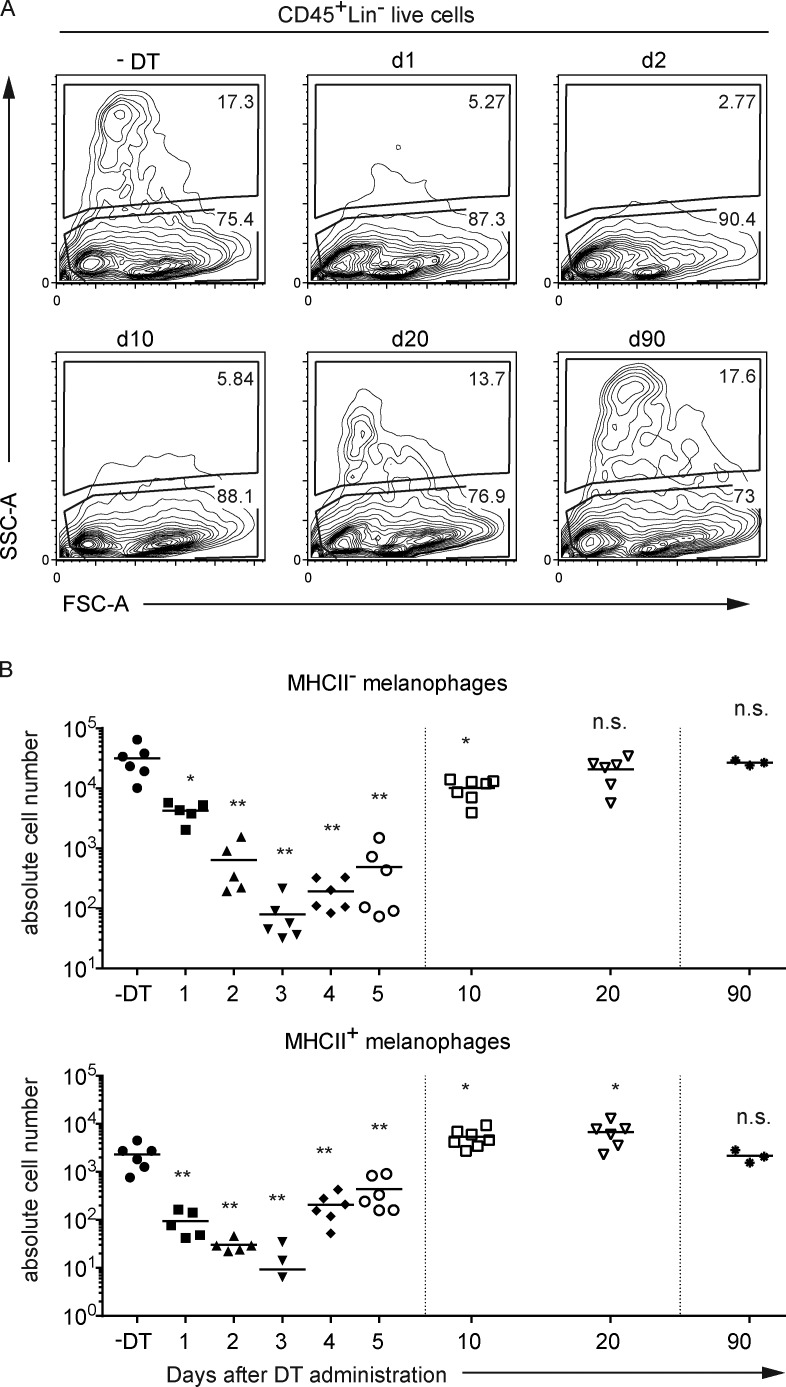
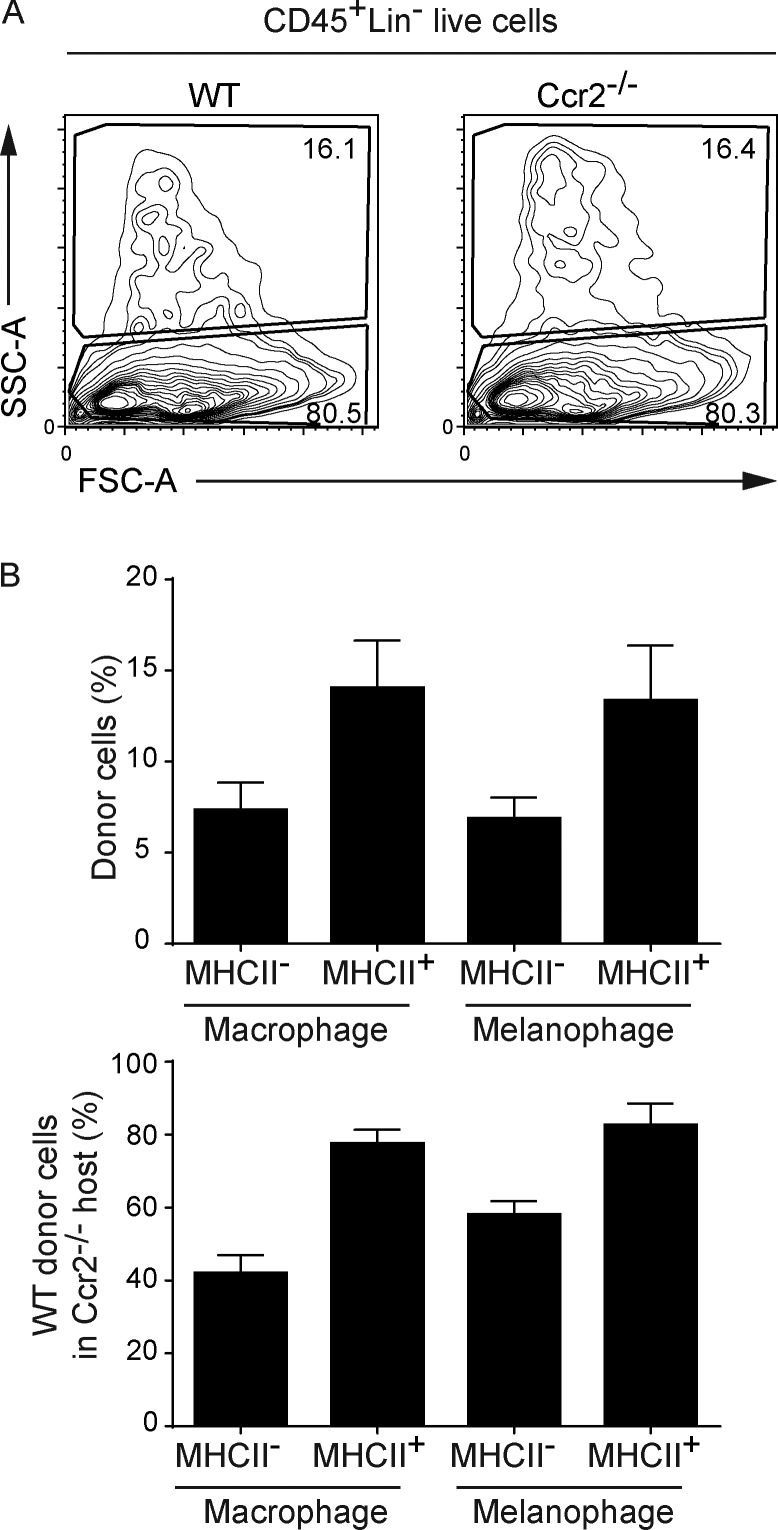
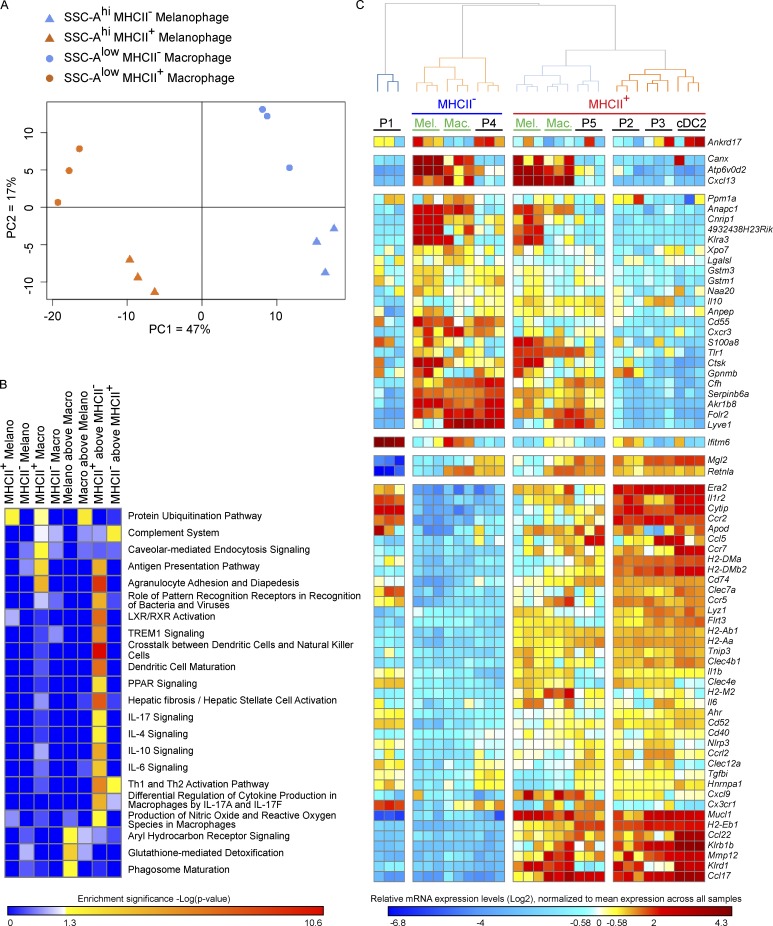
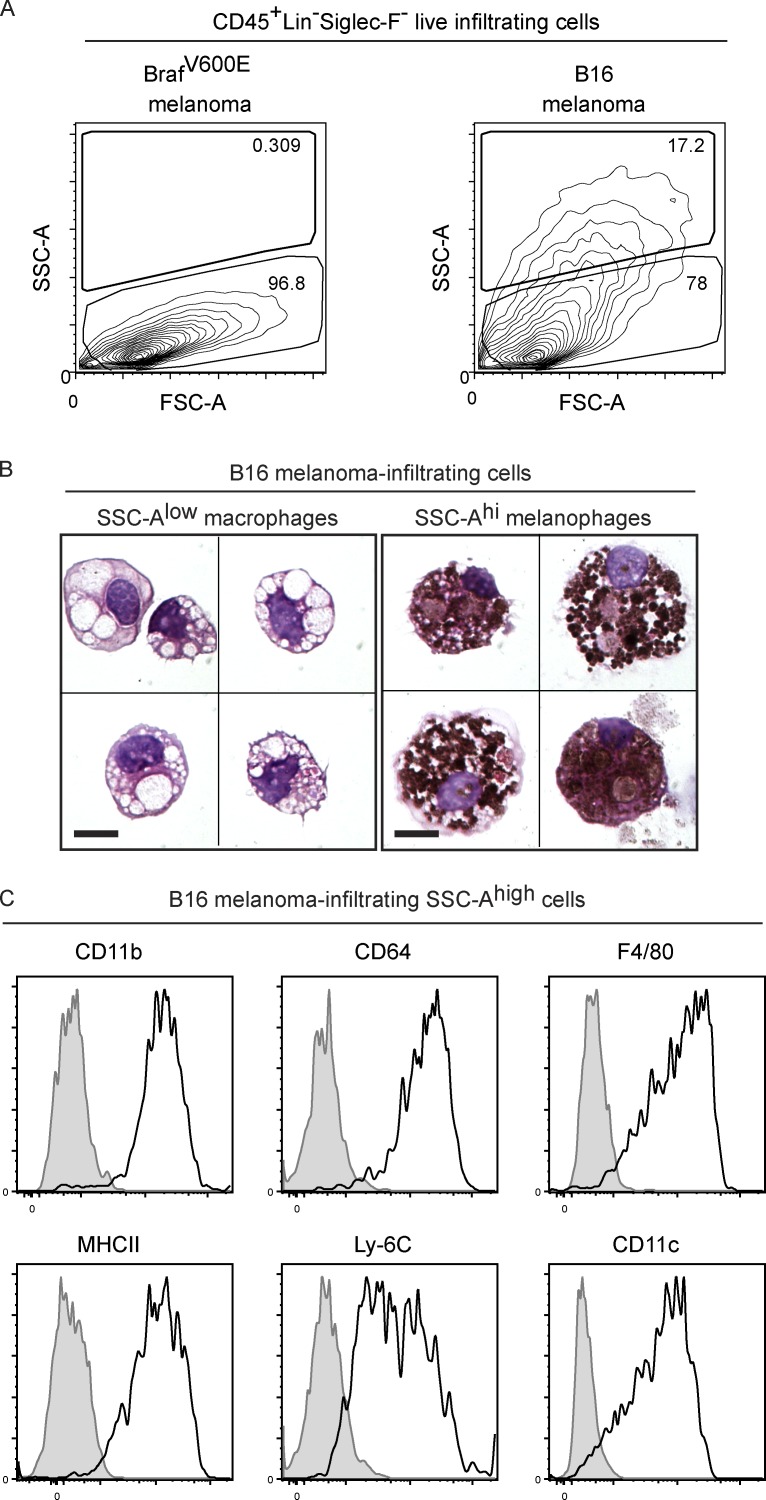
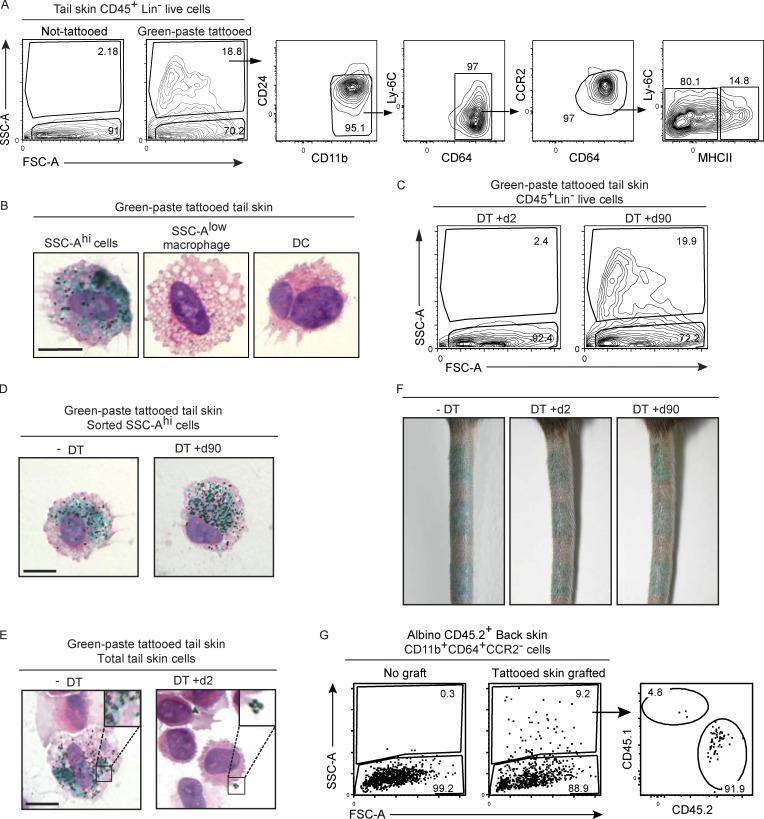
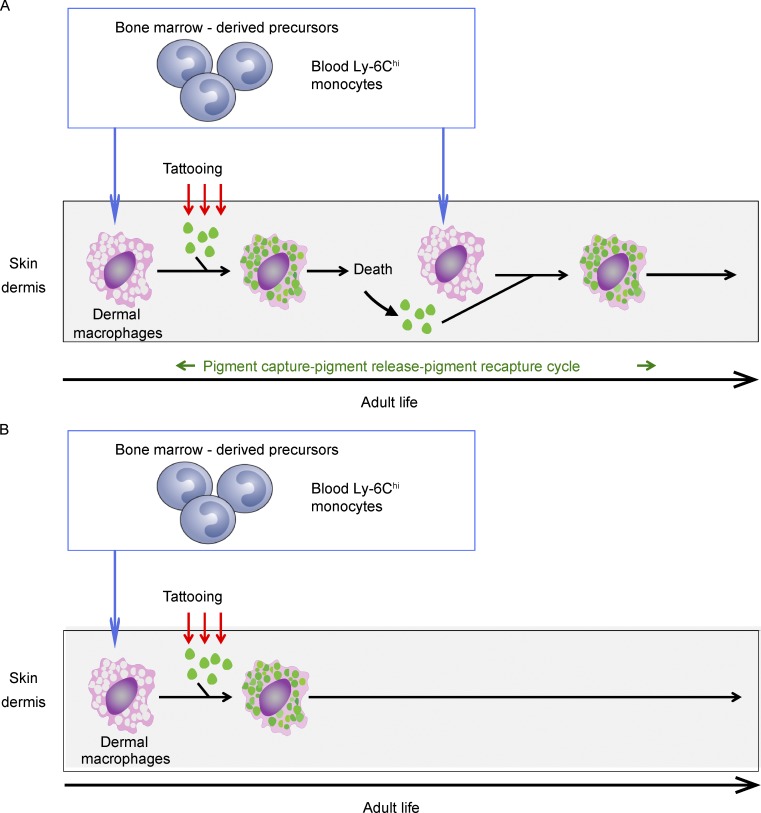
Here we describe a new mouse model that exploits the pattern of expression of the high-affinity IgG receptor (CD64) and allows diphtheria toxin (DT)-mediated ablation of tissue-resident macrophages and monocyte-derived cells. We found that the myeloid cells of the ear skin dermis are dominated by DT-sensitive, melanin-laden cells that have been missed in previous studies and correspond to macrophages that have ingested melanosomes from neighboring melanocytes. Those cells have been referred to as melanophages in humans. We also identified melanophages in melanocytic melanoma. Benefiting of our knowledge on melanophage dynamics, we determined the identity, origin, and dynamics of the skin myeloid cells that capture and retain tattoo pigment particles. We showed that they are exclusively made of dermal macrophages. Using the possibility to delete them, we further demonstrated that tattoo pigment particles can undergo successive cycles of capture-release-recapture without any tattoo vanishing. Therefore, congruent with dermal macrophage dynamics, long-term tattoo persistence likely relies on macrophage renewal rather than on macrophage longevity.


Figures

Figure 1.
Figure 1.
Replenishment kinetics of monocytes, mo-DCs, and macrophages in the dermis of CD64dtr mice after DT treatment. CD64dtr mice were left untreated (-DT) or treated twice and 24 h apart with DT. Analysis of the CD64+CCR2+monocytes and mo-DCs and CD64+CCR2 macrophages found in the ear dermis (Fig. S1 A) was performed before (-DT) and 1, 2, 3, 4, 5, 10, 20, and 90 d after the last DT injection. (A) CD64+CCR2+ dermal cells were analyzed at the specified time points by using Ly-6C–MHCII dot plots to define the percentages of Ly-6C+MHCII (P1) dermal monocytes, Ly-6C+MHCII+ (P2) mo-DCs, and Ly-6CMHCII+ (P3) mo-DCs (Tamoutounour et al., 2013). (B) Quantification of the results in A showing the absolute number of cells obtained from two ears of each mouse. Each symbol corresponds to a mouse and the mean (horizontal bar) is indicated. (C) CD64+CCR2 dermal cells were analyzed at the specified time points by using Ly-6C–MHCII dot plots to define the percentages of Ly-6CMHCII (P4) dermal macrophages and Ly-6CMHCII+ (P5) dermal macrophages (Tamoutounour et al., 2013). A Ly-6C+MHCII– to high cell population transiently developed 2–5 d after the last DT treatment and is denoted as Px cells. (D) Quantification of the results in C showing the absolute number of cells obtained from two ears of each mouse. Each symbol corresponds to a mouse and the mean (horizontal bar) is indicated. Data are representative of three independent experiments involving three to six animals per group. *, P ≤ 0.05; **, P ≤ 0.01; ***, P ≤ 0.001; unpaired Student’s t test.
Figure 2.
Figure 2.
Replenishment kinetics of blood monocytes of CD64dtr mice after DT treatment. (A) Gating strategy used to identify CD11b+Lin cell subsets within the blood. Red blood cells were lysed before analysis, and the absolute number of a given cell type present in a given blood volume was determined by staining samples in Trucount Absolute Counting Tubes. Beads were gated out on the basis of their FSC-A–SSC-A profile, and after excluding CD5+ T cells, CD19+ B cells, CD161+ NK cells, as well as SSC-Aint eosinophils, and Ly-6G+ neutrophils, the majority of the remaining CD11b+Lin cells were CD45+CD115+; when analyzed on CD115-CD43 dot plots, they comprise CD115+CD43 and CD115+CD43+ subsets. As expected, CD115+CD43 cells corresponded to Ly-6Chigh blood monocytes, whereas most CD115+CD43+ corresponded to Ly6-Clow blood monocytes. (B) Absolute number (mean values ± SD) of the specified cells in the blood of CD64dtr mice before and 1, 2, 3, 4, 5, 10, and 20 d after DT treatment. (C) CD115+CD43 monocytes were analyzed at the specified time points by using Ly-6C–MHCII dot plots to define the percentages of Ly-6ChighMHCII and Ly-6ChighMHCII+ monocytes. (D) CD115+CD43+ cells were analyzed at the specified time points by using Ly-6C–MHCII dot plots to define the percentages of Ly-6C+MHCII and Ly-6ClowMHCII monocytes. (E) Ly-6GSSC-Alow cells were analyzed at the specified time points by using CD115-CD45 dot plots to define the percentages of CD115int and CD115+ blood monocytes. Data are representative of at least three experiments involving three to six animals per group.
Figure 3.
Figure 3.
CD64dtr mice unveil the existence of a novel CD64+ cell population in the skin that is highly granular and DT sensitive and corresponds to melanophages. (A) Cell suspensions from the ear skin of CD64dtr mice were analyzed by flow cytometry before (-DT) or 48 h after (DT + 48 h) DT treatment. After excluding CD3+ T cells, CD19+ B cells, CD161+ NK cells, and Ly-6G+ neutrophils, the remaining lineage-negative (Lin) CD45+ live cells were analyzed by using FSC-A–SSC-A dot plots to define the percentages of SSC-Alow and SSC-Ahigh cells. (B) Comparative analysis of the SSC-Alow and SSC-Ahigh cells found in the ear skin by using a gating strategy resolving the cDC2s, monocytes, mo-DCs and macrophages present among CD45+LinCD11b+ cells (Fig. S1 A). The percentage of cells found in each of the specified gate is indicated. (C) Transversal tissue sections of B6 ear or trunk skin (at telogen and anagen phases) were stained with DAPI and analyzed by microscopy for the presence of melanin. Bars: (top) 100 μm; (bottom) 20 µm. (D) Morphological characteristics of CD64+CCR2SSC-Alow macrophages and CD64+SSC-Ahigh melanophages sorted from ear skin and analyzed by hematoxylin and eosin staining after cytospin onto glass slides. Two representative cells are shown for each population. Bar, 10 µm. (E) Morphological characteristics of CD64+SSC-Ahigh melanophages sorted from ear skin and analyzed by electron microscopy. Three representative cells are shown. Melanophages display an irregular nucleus surrounded by a prominent cytoplasm crowded with elongated melanin granules. Bars, 1 µm. Higher magnification shows pigment granules with a homogeneous and extremely dense content, attesting for its mature stage. Melanosomes are grouped together forming melanosome complexes (asterisks), but they are also singly dispersed in the cytoplasm, all of them are surrounded by a membrane. Bars, 0.5 µm. (F) En face section of ear dermis from CX3CR1Cre/+ Rosalsl-tdt/+ mice analyzed by confocal microscopy for the colocalization of melanin with CD64+ CX3CR1-fate-mapped macrophages (tdtomato+). Bars: (top) 50 µm; (bottom) 10 µm. Data are representative of two to three experiments. (G) CD11b+CD64+CCR2 cells from the ear skin and trunk skin of B6 (telogen and anagen phases) of B6 mice were analyzed for the percentages of SSC-Alow and SSC-Ahigh cells. Data are representative of at least two experiments involving three animals per group.
Figure 4.
Figure 4.
SSC-AhighCD64+ dermal cells correspond to melanophages. (A) CD45+Lin cells from the ear skin of B6, B6-albino, and BALB/c mice, the tail skin of B6 mice, and the lamina propria of the large intestine of B6 mice were analyzed for the percentages of SSC-Alow and SSC-Ahigh cells. As expected on the basis of the anatomical distribution of mouse melanocytes (Aoki et al., 2009), the lamina propria of B6 mice lacked melanophages. (B) Pie charts and corresponding frequencies of the indicated cells among CD11b+ noncDC2 cells found in the specified anatomical location and mice strain. Data corresponding to each pie chart were averaged from six mice and the corresponding percentages (mean values ± SD) are shown below the charts. Data are representative of at least three experiments involving three to six animals per group.
Figure 5.
Figure 5.
SSC-AhighCD64+ melanophages showed a protracted kinetics of replenishment after DT treatment compared with SSC-Alow macrophages. (A) CD45+Lin cells from the ear skin of CD64dtr mice were analyzed for the percentages of SSC-Alow and SSC-Ahigh cells before (-DT) or at the specified time points after DT treatment. (B) Quantification of the results in A are shown for the MHCII+ and MHCII cells found among the SSC-Ahigh melanophages. Each symbol corresponds to a mouse and the mean (horizontal bar) is indicated. Data are representative of two to three independent experiments involving three to six animals per group. n.s., P > 0.05; *, P ≤ 0.05; **, P ≤ 0.01; unpaired Student’s t test.
Figure 6.
Figure 6.
Prenatal and adult origins of SSC-AhighCD64+ melanophages. (A) CD45+Lin cells from the ear skin of B6 (WT) and Ccr2−/− mice were analyzed for the percentages of SSC-Alow and SSC-Ahigh cells. (B) Percentages (mean values ± SD) of donor chimerism in MHCII+ and MHCII dermal macrophages and MHCII+ and MHCII melanophages found in the skin dermis of parabiotic mice involving either CD45.1 and CD45.2 WT parabionts or CD45.1 WT and CD45.2 Ccr2−/− parabionts. No macrophages or melanophages originating from CCR2-deficient mice were found in the dermis of WT partners. Data are representative of two to three independent experiments involving two to four animals per group.
Figure 7.
Figure 7.
Gene expression profiling of MHCII+ and MHCII melanophages and macrophages from steady-state dermis. MHCII+ and MHCII CD64+CCR2SSC-Alow macrophages and MHCII+ and MHCII CD64+SSC-Ahigh melanophages were sorted in triplicates from ear skin and subjected to gene-expression profiling (Affymetrix 1.0ST). (A) PCA of gene expression by MHCII+ and MHCII dermal macrophages and MHCII+ and MHCII melanophages, based on all the 1,054 unique genes differentially expressed between at least one pair of experimental conditions. The percentage of overall variability of the dataset is indicated along each PC axis. (B) Heat map representation of selected functions and pathways found enriched by IPA for the lists of genes differentially expressed in one of the three cell types, between MHCII+ versus MHCII cells, or between melanophages and macrophages. (C) Heat map showing the expression pattern across skin monocytes (P1), mo-DCs (P2, P3), macrophages (P4, P5, Mac), melanophages (Mel), and cDC2s of selected genes contributing to IPA enrichments for the SSC-Alow macrophage, SSC-Ahi melanophage, and MHCII versus MHCII+ transcriptomic signatures. The cell samples which names are in black font on the top of the heat map originate from Tamoutounour et al. (2013), where the P4 and P5 cells correspond to the MHCII and MHCII+ macrophages from the present study. The exhaustive lists of genes responsible for the IPA enrichments shown in B are provided in Table S1.
Figure 8.
Figure 8.
SSC-AhighCD64+ melanophages can be found in melanocytic melanoma. (A) B6-albino mice were injected subcutaneously with 105 amelanocytic (BrafV600E) or melanocytic (B16) melanoma cells. CD45+LinSiglec-F cells were isolated from tumor masses 14–18 d after inoculation and analyzed for the percentages of SSC-Alow and SSC-Ahigh cells. Note that Siglec-F staining permits elimination of eosinophils. (B) Morphological characteristics of representative SSC-Ahigh melanophages and SSC-Alow macrophages sorted from B16 melanoma tumor masses after cytospin onto glass slides. Four representative cells are shown for each population. Panels are made of two to four concatenated images. Bars, 10 µm. (C) Analysis of CD45+LinSiglec-F SSC-Ahigh cells isolated from B16 melanoma tumor masses 14 d after inoculation for CD11b, CD64, F4/80, MHCII, Ly6C, and CD11c expression. Appropriate isotype controls are shown for each of the analyzed markers. Data are representative of at least three experiments involving three animals per group.
Figure 9.
Figure 9.
Dermal macrophages are responsible for uptake and storage of tattoo pigment particles. (A) CD45+Lin cells from the tail skin of B6 mice that were left untreated or tattooed with green tattoo ink paste 3 wk before isolation were analyzed for the percentages of SSC-Alow and SSC-Ahigh cells. SSC-Ahigh cells were further analyzed by using a gating strategy resolving cDC2s, monocytes, mo-DCs, and macrophages (Fig. S1 A). (B) Morphological characteristics of representative SSC-Ahigh cells (green macrophages), SSC-Alow cells (macrophages), and cDC2s sorted from tail skin of B6 mice tattooed with green tattoo paste 3 wk before isolation and analyzed by hematoxylin and eosin staining after cytospin onto glass slides. Bar, 10 µm. (C) Tails of CD64dtr mice were tattooed with green tattoo paste. 3 wk after, mice were treated twice and 24 h apart with 1 µg DT, and tail skin was analyzed 2 or 90 d after the last DT injection for the percentages of SSC-Alow and SSC-Ahigh cells found among CD45+Lin cells. (D) SSC-Ahigh cells were sorted from the tail skin of CD64dtr mice that were tattooed with green tattoo paste and either left untreated (-DT) or treated with DT and analyzed 90 d (DT + d90) after DT treatment. Sorted cells were analyzed by hematoxylin and eosin staining after cytospin onto glass slides. One representative cell is shown for each population. Bar, 10 µm. (E) Tail skin of CD64dtr mice that were tattooed with green tattoo paste and either left untreated (-DT) or treated with DT and analyzed 2 d (DT + d2) after DT treatment was digested, and the resulting cell suspension was directly analyzed by hematoxylin and eosin staining after cytospin onto glass slides. Insets show magnification of selected areas. Bar, 10 µm. (F) Macroscopic view of the tails of CD64dtr mice that were tattooed with green tattoo ink paste and either left untreated (-DT) or treated with DT and analyzed 2 (DT + d2) and 90 d (DT + d90) after DT treatment. Data are representative of at least three experiments. (G) CD11b+CD64+CCR2 cells from the back of untreated CD45.2 albino mice or from the back of CD45.2 albino mice previously grafted with green-tattooed tail skin from CD45.1 B6 animals were analyzed for the percentages of SSC-Alow and SSC-Ahigh cells. The SSC-Ahigh CD64+ cells found in the back of the grafted CD45.2 albino mice were further analyzed for the percentages of CD45.1 (donor) and CD45.2 (host) expression. Data are representative of two to three independent experiments involving two to four animals per group.
Figure 10.
Figure 10.
Models accounting for tattoo persistence. (A) The pigment capture–release–recapture model. Analysis of parabiotic mice that share a blood supply showed that the macrophage pool found in the noninflammatory dermis of adult mice is continuously replenished from circulating monocytes, thereby permitting replacement of dying macrophages. Upon tattooing, pigment particles (green) are captured by dermal macrophages. With time, macrophages laden with tattoo pigment particles die and release the tattoo pigment particles. Because of their size, those particles remain in an extracellular form at the site of tattooing where they are recaptured by neighboring or incoming macrophages. During the adult life, several cycles of pigment capture–release–recapture can occur, accounting for long-term tattoo persistence. (B) The “longevity” model. Although data on dermal macrophage dynamics (Tamoutounour et al., 2013; McGovern et al., 2014; and this paper) speak in favor of a pigment capture–release–recapture model, the possibility that a few dermal macrophages including those laden with green tattoo pigments had a longevity of the same order of adult mice cannot be excluded.

Comment in

  • Death, eaters, and dark marks.
    Collin M. Collin M. J Exp Med. 2018 Apr 2;215(4):1005-1006. doi: 10.1084/jem.20180311. Epub 2018 Mar 20. J Exp Med. 2018. PMID: 29559503 Free PMC article.

References

    1. Aoki H., Yamada Y., Hara A., and Kunisada T.. 2009. Two distinct types of mouse melanocyte: Differential signaling requirement for the maintenance of non-cutaneous and dermal versus epidermal melanocytes. Development. 136:2511–2521. 10.1242/dev.037168 - DOI - PubMed
    1. Autenrieth S.E., Warnke P., Wabnitz G.H., Lucero Estrada C., Pasquevich K.A., Drechsler D., Günter M., Hochweller K., Novakovic A., Beer-Hammer S., et al. . 2012. Depletion of dendritic cells enhances innate anti-bacterial host defense through modulation of phagocyte homeostasis. PLoS Pathog. 8:e1002552 10.1371/journal.ppat.1002552 - DOI - PMC - PubMed
    1. Bain C.C., Scott C.L., Uronen-Hansson H., Gudjonsson S., Jansson O., Grip O., Guilliams M., Malissen B., Agace W.W., and Mowat A.M.. 2013. Resident and pro-inflammatory macrophages in the colon represent alternative context-dependent fates of the same Ly6Chi monocyte precursors. Mucosal Immunol. 6:498–510. 10.1038/mi.2012.89 - DOI - PMC - PubMed
    1. Bain C.C., Bravo-Blas A., Scott C.L., Perdiguero E.G., Geissmann F., Henri S., Malissen B., Osborne L.C., Artis D., and Mowat A.M.. 2014. Constant replenishment from circulating monocytes maintains the macrophage pool in the intestine of adult mice. Nat. Immunol. 15:929–937. 10.1038/ni.2967 - DOI - PMC - PubMed
    1. Bigley V., Haniffa M., Doulatov S., Wang X.N., Dickinson R., McGovern N., Jardine L., Pagan S., Dimmick I., Chua I., et al. . 2011. The human syndrome of dendritic cell, monocyte, B and NK lymphoid deficiency. J. Exp. Med. 208:227–234. 10.1084/jem.20101459 - DOI - PMC - PubMed

Publication types

MeSH terms