. 2018 Mar 6;11(520):eaao1818.
doi: 10.1126/scisignal.aao1818.

Splenic leukocytes define the resolution of inflammation in heart failure

Affiliations

Splenic leukocytes define the resolution of inflammation in heart failure

Ganesh V Halade et al. Sci Signal. .

Abstract

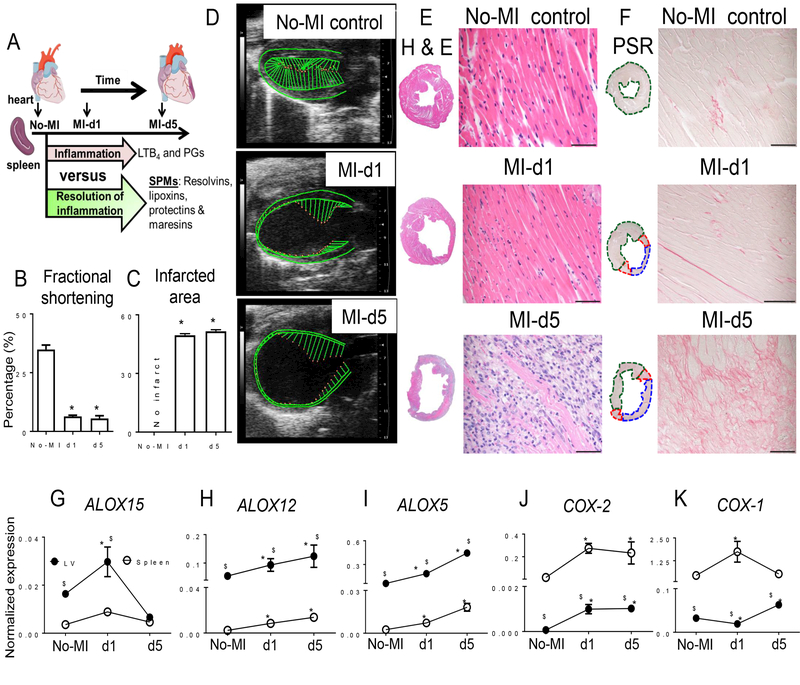
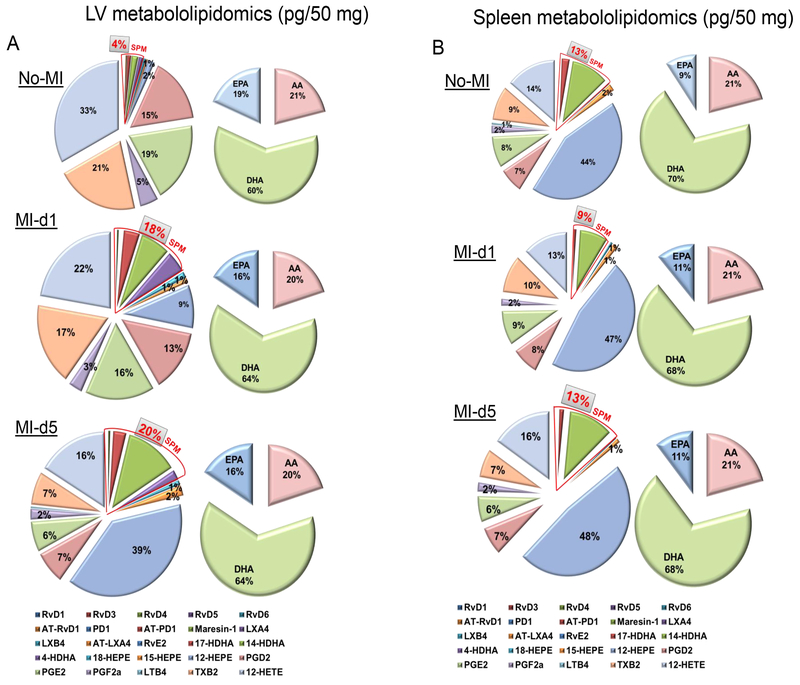
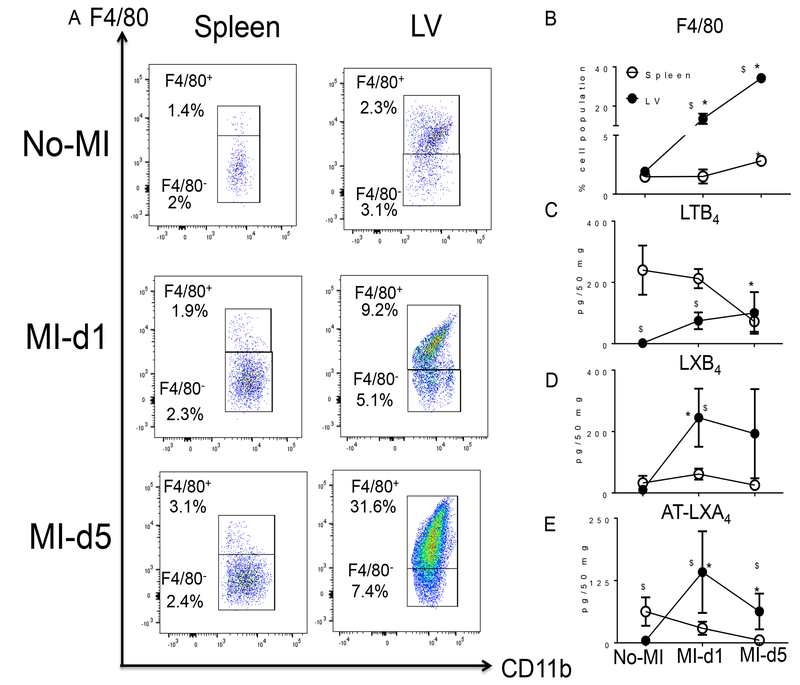
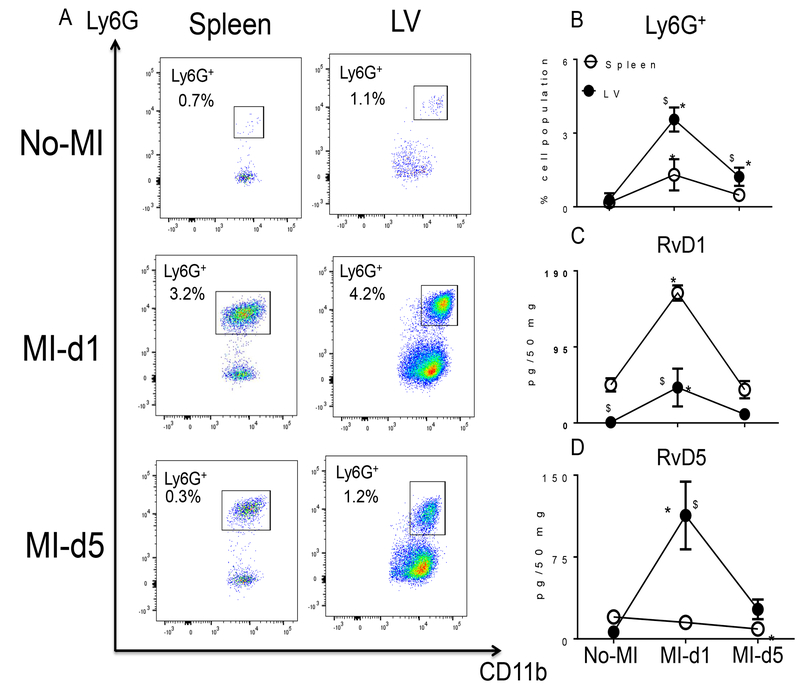
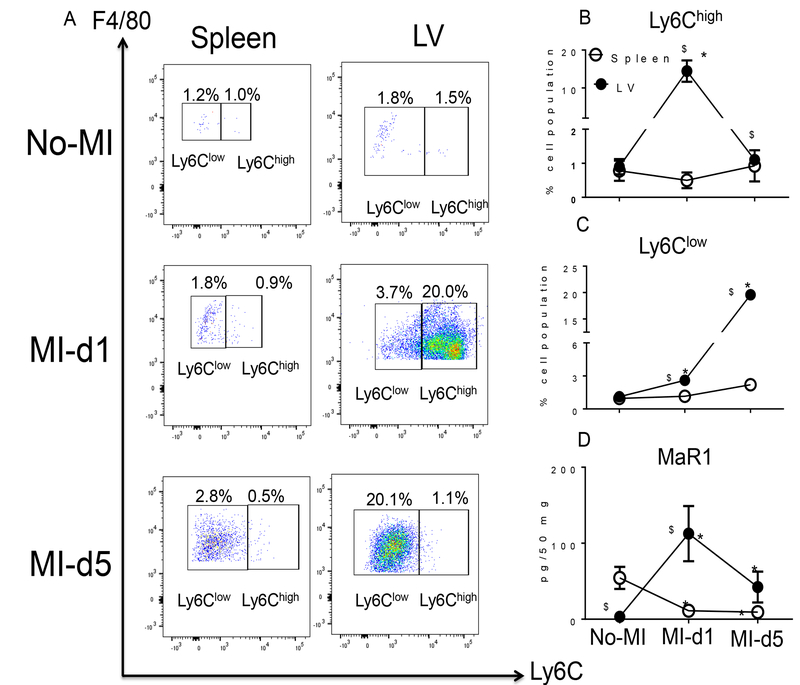
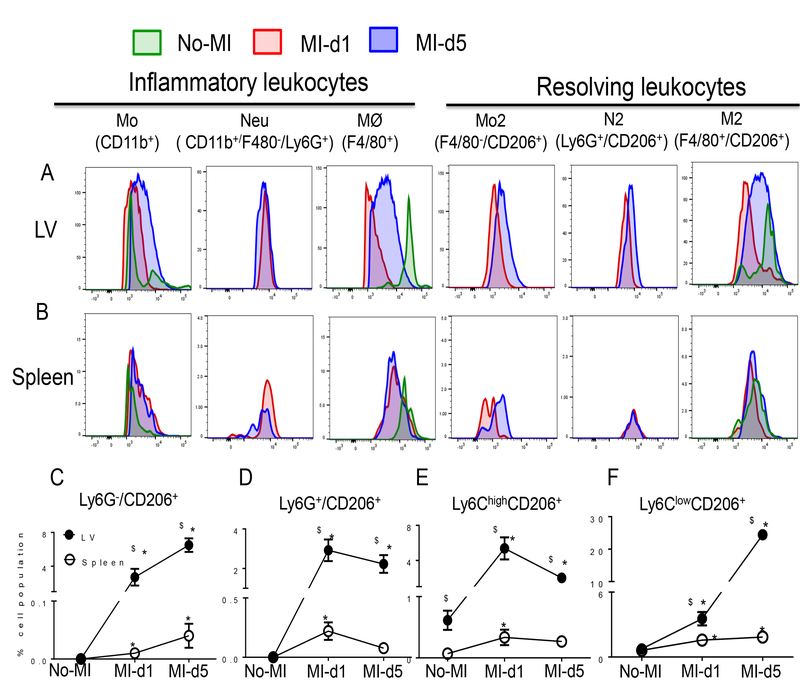
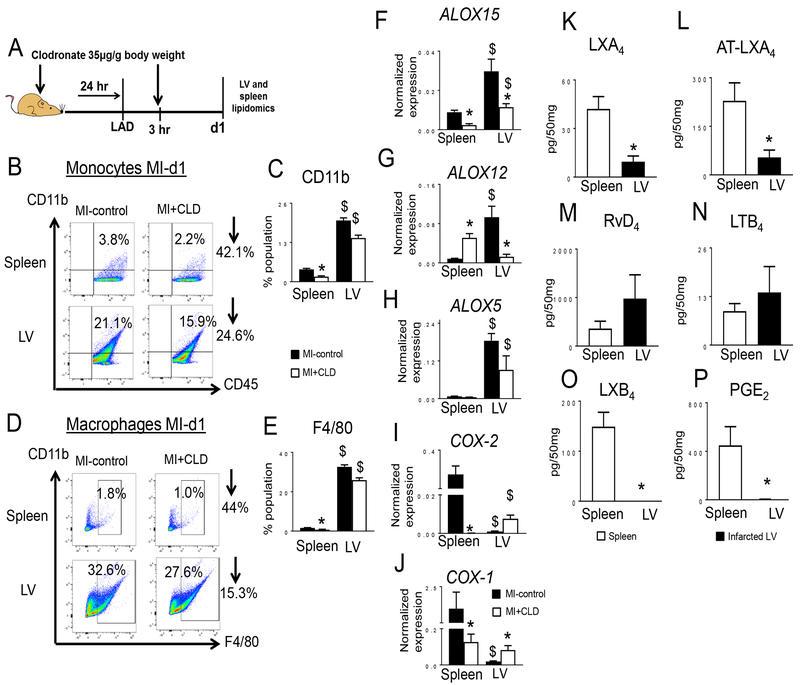
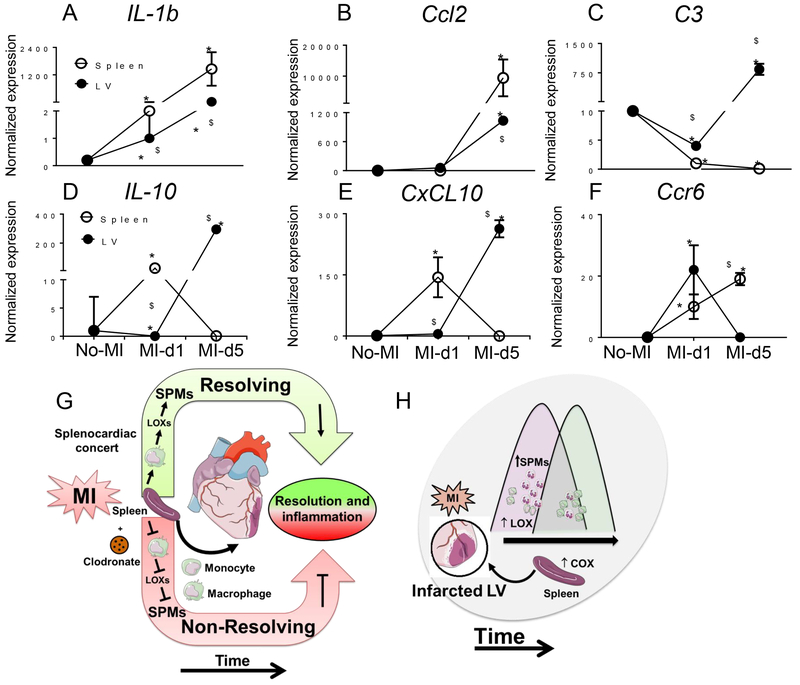
Inflammation promotes healing in myocardial infarction but, if unresolved, leads to heart failure. To define the inflammatory and resolving responses, we quantified leukocyte trafficking and specialized proresolving mediators (SPMs) in the infarcted left ventricle and spleen after myocardial infarction, with the goal of distinguishing inflammation from its resolution. Our data suggest that the spleen not only served as a leukocyte reservoir but also was the site where SPMs were actively generated after coronary ligation in mice. Before myocardial infarction, SPMs were more abundant in the spleen than in the left ventricle. At day 1 after coronary ligation, the spleen was depleted of leukocytes, a phenomenon that was associated with greater numbers of leukocytes in the infarcted left ventricle and increased generation of SPMs at the same site, particularly resolvins, maresin, lipoxins, and protectin. In addition, the infarcted left ventricle showed increased expression of genes encoding lipoxygenases and enhanced production of SPMs generated by these enzymes. We found that macrophages were necessary for SPM generation. The abundance of SPMs in the spleen before myocardial infarction and increased SPM concentrations in the infarcted left ventricle within 24 hours after myocardial infarction were temporally correlated with the resolution of inflammation. Thus, the acute inflammatory response coincided with the active resolving phase in post-myocardial infarction and suggests that further investigation into macrophage-derived SPMs in heart failure is warranted.


Conflict of interest statement

Competing interests: The authors declare that they have no competing interests.

Figures

Figure 1.
Figure 1.. Infarcted LV healing is associated with expression of different LOX isoforms in mice post-MI.
A. Study design. B. Fractional shortening (%) measured from the long axis. n=6 mice/group/day. C. Post-MI percentage of LV infarcted area compared to naïve controls with no infarct. n=6 mice/group/day. D. Representative echocardiographic long axis B-mode images of naïve control, and post-MI d1 and d5. E and F. Representative images from horizontal sections of LV mid-cavity stained with (E) hematoxylin and eosin and (F) picrosirius red. Scale bar, 50 μm. n=6 mice/group/day. G to I. Expression analysis of (G) ALOX15, (H) ALOX12, (I) and ALOX5 in infarcted LV or spleen from naïve control mice or at the indicated time points after MI. Expression was normalized to Hprt-1. n=6 mice/group/day. J-K. Expression analysis of (J) COX-2 and (K) COX-1 in infarcted LV from naïve control mice or at the indicated time points post-MI. LOX and COX gene expression was normalized to Hprt-1. N=6 mice/group/day. *p<0.05 compared to no-MI naïve control and $p<0.05 compared to spleen at respective day time point using one way ANOVA.
Figure 2.
Figure 2.. SPM biosynthesis peaked in the infarcted LV and was reduced in spleen post-MI within 24 h.
A. Pie chart representing the distribution of SPMs and docosahexaenoic acid (DHA), eicosapentaenoic acid (EPA) and arachidonic acid (AA) in infarcted LV from naïve control mice or at the indicated time points post-MI. n=4 mice/group/day. B. Pie chart representing the distribution of SPMs and docosahexaenoic acid (DHA), eicosapentaenoic acid (EPA) and arachidonic acid (AA) metabolome in spleen from naïve control mice or at the indicated time points post-MI. Percentage of mean values for each of the lipid mediators identified are presented in the pie chart. n=4 mice/group/day. Quantification and values are pg/ 50 mg LV tissue from apex to base and pg/50mg spleen tissue. The detection limit was ~1 pg.
Figure 3.
Figure 3.. Infarcted LV macrophage activation is inversely proportional to lipoxin kinetics in the spleen within 24 h post-MI.
A. Representative flow cytometry (FACs) dot plots showing the macrophage population (CD11b+/F4/80+) in spleen (left panel) and LV mononuclear cells (right panel) in no-MI naïve control and at d1 and d5 post-MI. B. Line graph showing the percentage of the F4/80+ population in spleen and LV mononuclear cells at d0, post-MI d1 and d5. n=4 mice/group/day. C. Line graph showing the kinetics of LTB4 in LV and spleen in no-MI control and at d1 and d5 post-MI. n=4 mice/group/day. D. Line graph showing the kinetics of LXB4 in no-MI control and at d1 and d5 post-MI in LV and spleen. n=4 mice/group/day. E. Line graph showing the kinetics of AT-LXA4 in LV and spleen in no-MI control and at d1 and d5 post-MI. Results are mean±SEM. Quantification and values in C, D, and E are pg/50 mg of spleen or infarcted LV tissue from apex to base. The detection limit was ~1 pg. *p<0.05 compared to no-MI naïve control and $p<0.05 compared to spleen at respective day time point using one way ANOVA.
Figure 4.
Figure 4.. Infarcted LV contains activated leukocytes and SPM biosynthesis is increased in spleen and infarcted myocardium post-MI.
A. Representative flow cytometry (FACs) dot plots showing the neutrophil population (CD11b+/Ly6G+) in spleen (left panel) and LV mononuclear cells (right panel) in no-MI naïve control and at d1 and d5 post-MI. B. Line graph showing the percentage of the Ly6G+ population in spleen and LV mononuclear cells at d0, and d1 and d5 post-MI. n=4 mice/group/day. C. Line graph showing the kinetics of RvD1 in LV and spleen in no-MI control and at d1 and d5 post-MI. n=4 mice/group/day. D. Line graph showing the kinetics of RvD5 in LV and spleen at d1 and d5 post-MI compared to spleen and LV d0 naïve controls. n=4 mice/group/day. Quantification and values in C and D are pg/50 mg of spleen or infarcted LV tissue from apex to base. *p<0.05 compared to no-MI naïve control and $p<0.05 compared to spleen at respective day time point using one way ANOVA.
Figure 5.
Figure 5.. Splenic monocyte/macrophage subsets (F4/80+/Ly6Clow) that increase in the infarcted LV within 24 h are associated with biosynthesis of maresin 1 (MaR1).
A. Representative flow cytometry (FACs) dot plots showing macrophage population (F4/80+/Ly6C+) in spleen (left panel) and LV mononuclear cells (right panel) in no-MI naive control and at d1 and d5 post-MI. B. Line graph showing the percentage of the Ly6Chigh population in spleen and LV mononuclear cells at d0, d1 and d5 post-MI. n=4 mice/group/day. C. Line graph showing the percentage of the Ly6Clow population in spleen and LV mononuclear cells in d0 naïve controls and at d1 and d5 post-MI. n=4 mice/group/day. D. Line graph showing the kinetics of MaR1 in LV and spleen in no-MI control and at d1 and d5 post-MI. n=4 mice/group/day. Results are mean±SEM. Quantification and values of analytes are pg/50 mg of spleen or LV infarct tissue from apex to base. The detection limit was ~1 pg. *p<0.05 compared to no-MI naïve control. $p<0.05 compared to spleen at respective day time point using one way ANOVA.
Figure 6.
Figure 6.. Leukocyte activation in infarcted LV and spleen is associated with overlapping inflammatory and resolving phenotypes.
A. Representative histogram overlay of inflammatory and resolving leukocytes in LV. n=4 mice/group/day. B. Representative histogram overlay of inflammatory and resolving leukocytes in spleen. n=4 mice/group/day. C-F. Line graphs showing the kinetics of the C. Ly6G/CD206+ D. Ly6G+/CD206+ E. Ly6Chigh/CD206+ F. and Ly6Clow/CD206+ populations in LV and spleen. Results are expressed as mean±SEM, n=4 mice/group/day. *p<0.05 compared to no-MI naïve control and $p<0.05 compared to spleen at respective day time point using one way ANOVA (Mo; monocytes, Neu; Neutrophils, M⊘; macrophages; N2 resolving neutrophils, M2; resolving macrophages)
Figure 7.
Figure 7.. Macrophage depletion reduced LOXs expression thereby SPMs post-MI.
A. Scheme illustrating the experimental design for clodronate (CLD) treatment in MI model. B. Representative flow cytometry (FACs) dot plots showing the monocyte population (CD11b+CD45+) mononuclear cells in spleen (upper panel) and infarcted LV (lower panel) in MI-control and CLD injected mice. C. Bar graph representing CD11b+ cells. D. FACs dot plots showing the mononuclear macrophage population (CD11b+F4/80+) in spleen (upper panel) and infarcted LV (lower panel) in MI-control and CLD-injected mice. E. Bar graph representing F4/80+ cells (open bar MI-control and filled bar MI+CLD). n=4 mice/group. F-H. Gene expression analysis of F. ALOX15, G. ALOX12, H ALOX5, in infarcted LV post-MI in CLD-injected mice. Gene expression was normalized to Hprt-1. n=4 mice/group. I-J. Gene expression analysis of I. COX-2, J. COX-1 in infarcted LV post-MI in CLD-injected mice. Gene expression was normalized to Hprt-1. n=4 mice/group. *p<0.05 compared to MI control and $p<0.05 compared to spleen using one way ANOVA. K-P. Measurement of K. LXA4, L. AT-LXA4, M. RvD4, N. LTB4, O. LXB4, and P. PGE2 in spleen (open bar) and infarcted LV (filled bar) at day 1 post-MI after CLD-mediated macrophage depletion. Results are Mean±SEM values; n=3 mice/group. Quantified values of analytes are pg/50 mg of spleen or LV infarct tissue from apex to base. The detection limit was ~1 pg.
Figure 8.
Figure 8.. Activated cytokine and chemokine signal is amplified early in spleen than LV in post-MI resolution of inflammation.
A-F. mRNA expression of A. IL-1b, B. Ccl2, C C3, D. IL-10, E. CxCL10, and F. Ccr6 in spleen or infarcted LV from naïve control mice or at the indicated time points post-MI. Results are expressed as mean±SEM, n=4 mice/group. *p<0.05 compared to no-MI naïve control and $p<0.05 compared to spleen at respective day time point using one way ANOVA. G. Model showing that leukocytes in the spleen generated SPMs through LOX isoforms that advance the resolution of inflammation and healing in the LV post-MI. Clodronate (CLD)-mediated macrophage depletion reduced the expression of LOX isoforms and generation of SPMs, thereby triggering non-resolving inflammation that can lead to HF. H. Model showing that post-MI, LOXs are preferentially activated in the infarcted LV to generate SPMs that promote cardiac repair.

Similar articles

Cited by

References

    1. Kain V, Prabhu SD, Halade GV, Inflammation revisited: inflammation versus resolution of inflammation following myocardial infarction. Basic Res Cardiol 109, 444 (2014). - PubMed
    1. Prabhu SD, Frangogiannis NG, The Biological Basis for Cardiac Repair After Myocardial Infarction: From Inflammation to Fibrosis. Circ Res 119, 91–112 (2016). - PMC - PubMed
    1. Tourki B, Halade G, Leukocyte diversity in resolving and nonresolving mechanisms of cardiac remodeling. FASEB J 31, 4226–4239 (2017). - PMC - PubMed
    1. Serhan CN, Yacoubian S, Yang R, Anti-inflammatory and proresolving lipid mediators. Annual review of pathology 3, 279–312 (2008). - PMC - PubMed
    1. Tabas I, Glass CK, Anti-inflammatory therapy in chronic disease: challenges and opportunities. Science 339, 166–172 (2013). - PMC - PubMed

Publication types

MeSH terms