. 2018 Mar 6;9(1):827.
doi: 10.1038/s41467-018-03202-2.

Gene-by-environment interactions in urban populations modulate risk phenotypes

Affiliations

Gene-by-environment interactions in urban populations modulate risk phenotypes

Marie-Julie Favé et al. Nat Commun. .

Abstract

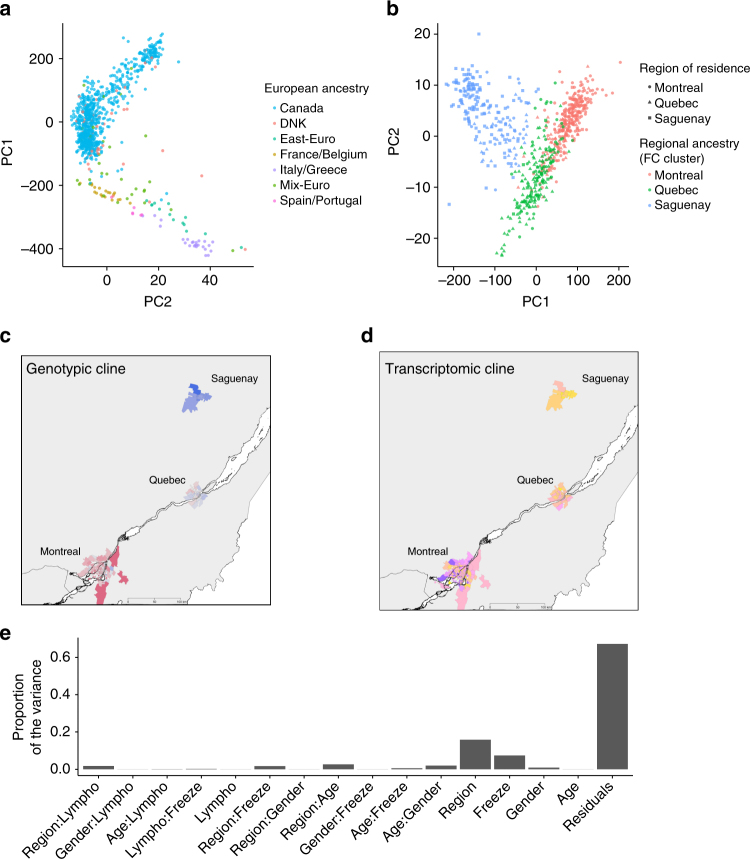
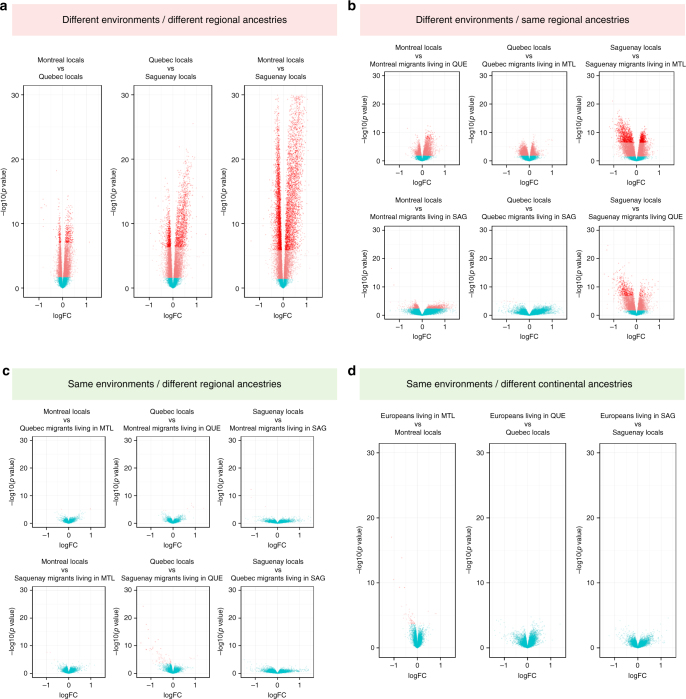
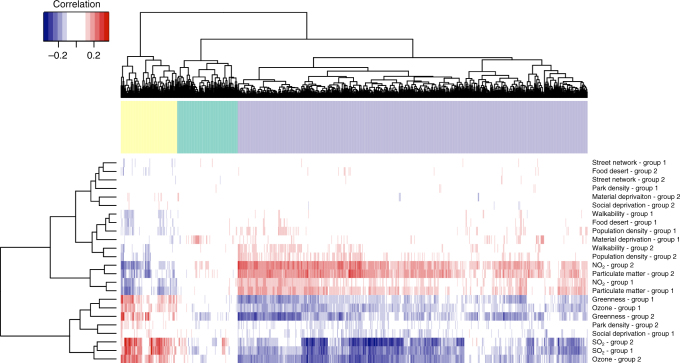
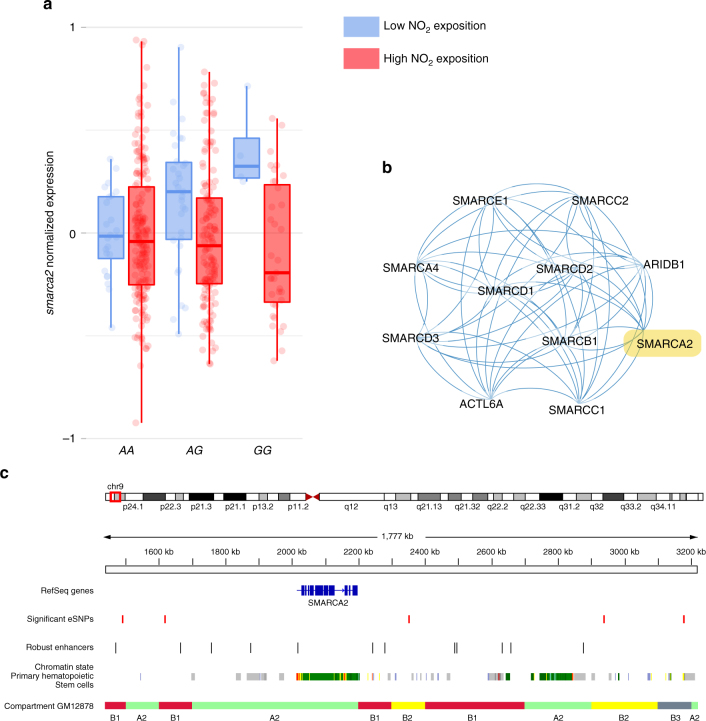
Uncovering the interaction between genomes and the environment is a principal challenge of modern genomics and preventive medicine. While theoretical models are well defined, little is known of the G × E interactions in humans. We used an integrative approach to comprehensively assess the interactions between 1.6 million data points, encompassing a range of environmental exposures, health, and gene expression levels, coupled with whole-genome genetic variation. From ∼1000 individuals of a founder population in Quebec, we reveal a substantial impact of the environment on the transcriptome and clinical endophenotypes, overpowering that of genetic ancestry. Air pollution impacts gene expression and pathways affecting cardio-metabolic and respiratory traits, when controlling for genetic ancestry. Finally, we capture four expression quantitative trait loci that interact with the environment (air pollution). Our findings demonstrate how the local environment directly affects disease risk phenotypes and that genetic variation, including less common variants, can modulate individual's response to environmental challenges.


Conflict of interest statement

The authors declare no competing financial interests.

Figures

Fig. 1
Fig. 1
Genetic and transcriptomic variation within the CARTaGENE cohort sample. a Principal component analysis (PCA) of individuals of European descent, including FCs (n = 887). Individuals are labeled according to self-declared ancestry based on the origin of four grandparents. b PCA on the haplotype chunk count matrix of French-Canadians (n = 689) reveals three groups corresponding the region of residence, with SAG individuals showing less overlap with either of MTL or QUE individuals, in line with their historical isolation, . c Genotypic cline for individuals by location of residence (three-digit postal code) sampled across the province. Color indicate the average value of the first principal component from a PCA on genotypes in each  three-digit postal code district level (n = 157). d Transcriptomic cline for individuals by location of residence sampled across the province. Colors represent the average value of the first principal component from a PCA on the transcriptome in each three-digit postal code district level (n = 189). e Proportion of transcriptomic variance (PVCA) in FCs explained by low-level phenotypes and their interactions
Fig. 2
Fig. 2
Environmental impacts on gene expression profiles override that of genotype. Contrasting the effects of ancestry and regional environment on differential gene expression. a Between FC-locals (different regional ancestry, different regional environments). b Between FC-locals and FC regional migrants (same regional ancestry, different regional environments). c Between FC-locals and FC regional migrants (different regional ancestries, same regional environment). d Between FC-locals and Europeans (different continental ancestries, same regional environment). Pink dots are genes with FDR (q value) below 5% and red dots are genes with p value < Bonferroni-corrected p value (3.20 × 10−6)
Fig. 3
Fig. 3
Differentially expressed genes are associated with local ambient air pollution. Coinertia (CoIA) analysis between gene expression (columns) and fine-scale environmental variables (rows). CoIA analyses were performed on genes that were significantly differentially expressed among regions and the regulators of those genes (RDEG). CoIAs were computed between differentially expressed genes profiles and fine-scale environmental data (Supplementary Figs 11 and 12). We performed two sets (Group 1 and Group 2, each composed of a random draw of half the cohort) of CoIAs: each set included 10,000× resampling of 200 individuals (without replacement, from Group 1 or Group 2), and the CoIAs were performed between environment and gene expression for each of the 10,000 iterations. Supplementary Fig. 11 depicts the resampling scheme. The heatmap represents, for each Group 1 or Group 2, the median of each environment–gene associations from the cross-tabulated values distribution. Associations from Group 1 and Group 2 largely cluster together, indicating a strong signal of the association between fine-scale air pollution levels and gene expression. A permutation test (n = 10,000 steps) indicates the that the correlations between the matrices are significant (p = 0.00089 and p = 9.9 × 10−5 for Group 1 and 2 respectively)
Fig. 4
Fig. 4
NO2 exposure modulates the effect of the top genetic variant rs10156534 on smarca2 expression. a The expression level of smarca2, an ATP-dependant helicase involved in several cancers, is modulated by the genotype at rs10156534 and NO2 exposition levels. b SMARCA2 is part of a highly connected gene network, the SNF/SWI complex, which acts to remodel chromatin structure and is required to activate transcription of repressed genes. c Several enhancers around smarca2 are found nearby or at location where eSNPs were significant for an interaction with pollution. The upper whiskers extend from the third quartile to the largest value no further than 1.5 * inter-quartile range from the third quartile. The lower whiskers extend from the first quartile to the smallest value at most 1.5 * inter-quartile range from the first quartile

Similar articles

Cited by

References

    1. Gibson G. The environmental contribution to gene expression profiles. Nat. Rev. Genet. 2008;9:575–581. doi: 10.1038/nrg2383. - DOI - PubMed
    1. Rappaport SM, Smith MT. Epidemiology. Environment and disease risks. Science. 2010;330:460–461. doi: 10.1126/science.1192603. - DOI - PMC - PubMed
    1. Ye CJ, et al. Intersection of population variation and autoimmunity genetics in human T cell activation. Science. 2014;345:1254665. doi: 10.1126/science.1254665. - DOI - PMC - PubMed
    1. Wu S, Powers S, Zhu W, Hannun YA. Substantial contribution of extrinsic risk factors to cancer development. Nature. 2016;529:43–47. doi: 10.1038/nature16166. - DOI - PMC - PubMed
    1. Nelson MR, et al. An abundance of rare functional variants in 202 drug target genes sequenced in 14,002 people. Science. 2012;337:100–104. doi: 10.1126/science.1217876. - DOI - PMC - PubMed

Publication types

LinkOut - more resources