. 2018 Mar 6;9(1):964.
doi: 10.1038/s41467-018-03357-y.

Herbivorous turtle ants obtain essential nutrients from a conserved nitrogen-recycling gut microbiome

Affiliations

Herbivorous turtle ants obtain essential nutrients from a conserved nitrogen-recycling gut microbiome

Yi Hu et al. Nat Commun. .

Erratum in

Abstract

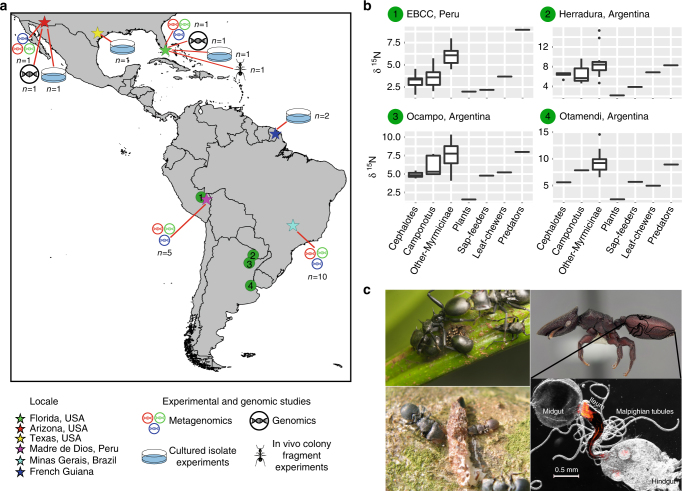
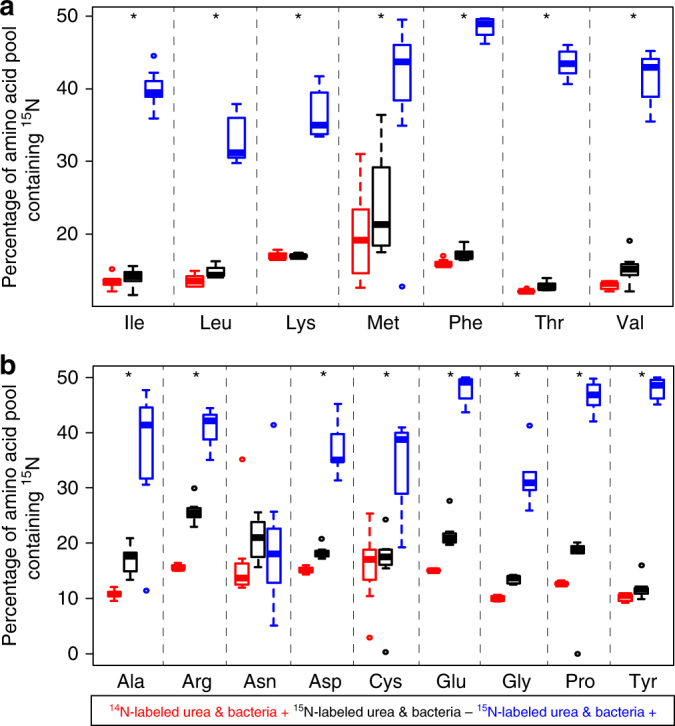
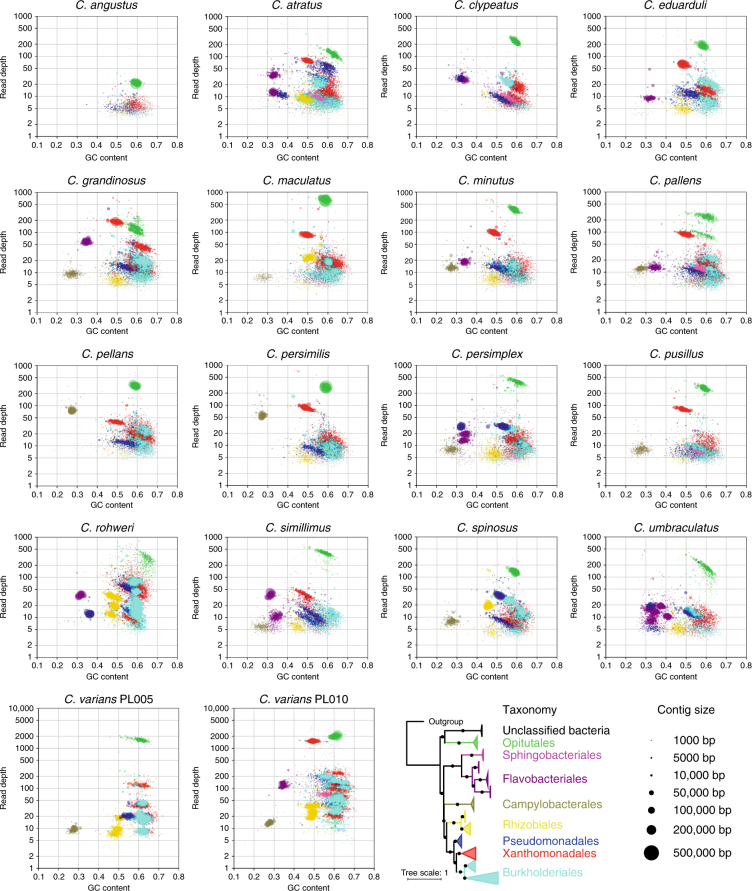
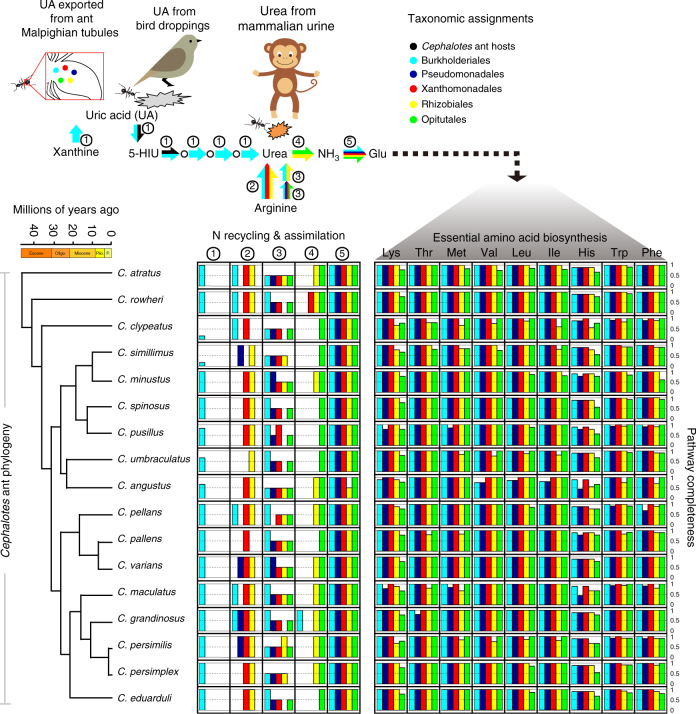
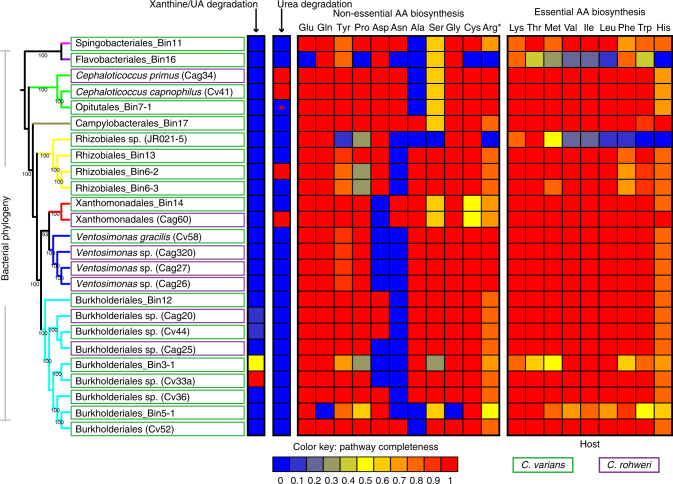
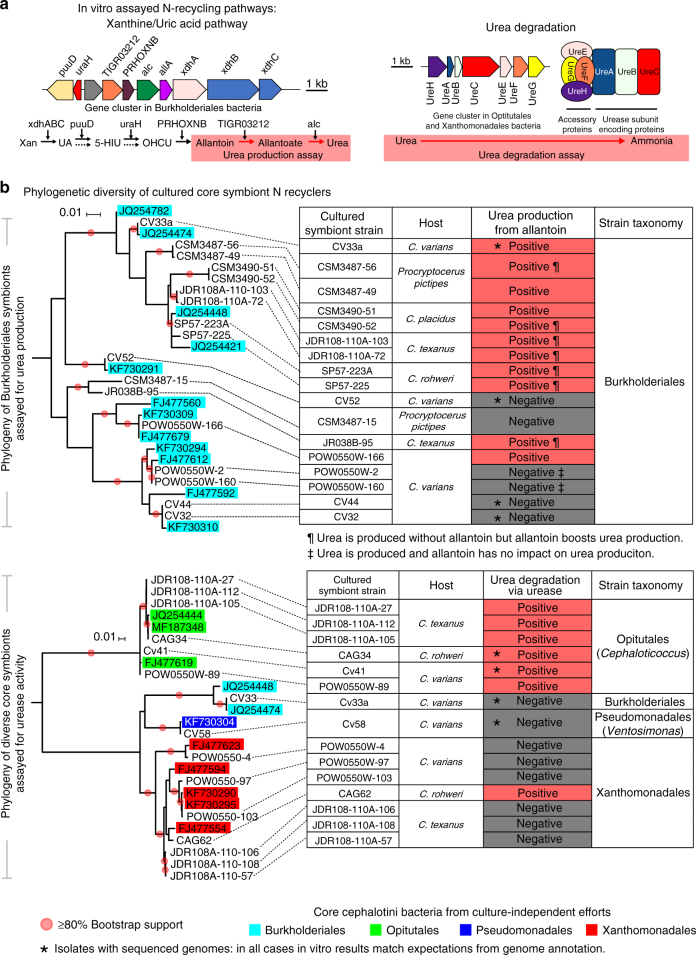
Nitrogen acquisition is a major challenge for herbivorous animals, and the repeated origins of herbivory across the ants have raised expectations that nutritional symbionts have shaped their diversification. Direct evidence for N provisioning by internally housed symbionts is rare in animals; among the ants, it has been documented for just one lineage. In this study we dissect functional contributions by bacteria from a conserved, multi-partite gut symbiosis in herbivorous Cephalotes ants through in vivo experiments, metagenomics, and in vitro assays. Gut bacteria recycle urea, and likely uric acid, using recycled N to synthesize essential amino acids that are acquired by hosts in substantial quantities. Specialized core symbionts of 17 studied Cephalotes species encode the pathways directing these activities, and several recycle N in vitro. These findings point to a highly efficient N economy, and a nutritional mutualism preserved for millions of years through the derived behaviors and gut anatomy of Cephalotes ants.


Conflict of interest statement

The authors declare no competing interests.

Figures

Fig. 1
Fig. 1
Ecology of Cephalotes ants and origins of specimens used in our study. a Map showing sampling locales for cephalotines (Cephalotes and Procryptocerus) used in this study (stars), the activities they were used for, along with sample size (i.e., number of species). Numbered circles show sites of ant sampling in two prior studies,, from which stable nitrogen isotope data were extracted and plotted here. The map was constructed using an open source geographic information system QGIS software version 2.18. b Nitrogen isotope data from prior studies, targeting several New World locales. Each separate box plot graphs the median (center line), the interquartile range (i.e., from the top to the bottom of each box), values equal to 1.5 times the interquartile range (tops and bottoms of whiskers), along with outliers. Graphed are isotope ratios for Cephalotes ants, other ants in their subfamily (Myrmicinae), and Camponotus ants, which host known N-recycling bacteria. Also plotted are data for plants, insect herbivores, and insect carnivores from the same locales. Isotope fractionation results in a gradual increase in the relative amounts of heavy nitrogen (15N), as one moves up the food chain. As such, ants with low amounts of the heavy nitrogen isotope, shown here using the δ15N statistic, are argued to feed at low trophic levels. c C. atratus workers tend honeydew-producing, ant-mimicking membracids (upper left, image credit: Jon Sanders). C. eduarduli and C. maculatus (smaller worker) feeding on bird droppings (lower left, from Fig. 2b of Russell et al., used with permission from Myrmecological News and photographer Scott Powell). Soldier caste of C. varians with an outlined digestive tract (upper right, image credit: Corrie Moreau). A FISH microscopy image of a digestive tract from a Cephalotes worker is shown at lower right (image credit: Piotr Lukasik). Note the large bacterial mass in the ileum near the midgut–ileum junction, the site where N wastes are emptied via Malpighian tubules
Fig. 2
Fig. 2
Symbiont suppression reduces proportions of 15N-labeled amino acids in hemolymph of Cephalotes varians workers consuming 15N-labeled urea. a Essential and b non-essential amino acids in ant hemolymph measured through GC–MS. Asterisks indicate that 15N in essential amino acids from ants consuming 15N-labeled urea (blue) was significantly higher than that in antibiotic-treated ants on this same diet (black) and in those consuming diets with unlabeled urea (red). Details on sample sizes for each treatment can be found in Supplementary Data 6. Note that each separate box plot graphs the median (center line), the interquartile range (i.e., from the top to the bottom of each box), values equal to 1.5 times the interquartile range (tops and bottoms of whiskers), and outliers. Amino acids for which we observed significantly higher heavy isotope signal in the no antibiotic (blue) versus antibiotic (black) treatments, on the heavy isotope diet, are indicated with an asterisk. Statistics are described in the Supplementary Methods and Supplementary Table 3. In short, asterisks reveal results from Tukey’s post hoc tests (for normally distributed data after logit transformation) or Wilcoxon rank sum tests (for non-normal data after logit transformation)
Fig. 3
Fig. 3
Taxon-annotated GC-coverage plots for 18 Cephalotes metagenomes reveal strong microbiome conservation. Assembled scaffolds in each metagenome are plotted based on their %GC content (x-axis) and their depth of sequencing coverage (y-axis, log scale). Bacterial genomes vary in %GC genome content and core symbionts show variable abundance; these plots, thus, illustrate the co-existence of numerous dominant symbiont strains in Cephalotes worker guts. The phylogeny at lower right, based on 16S rRNA sequences from our metagenomes, identifies the Cephalotes-specific clades from which nearly all of our sequence data have been obtained. Colors on the phylogeny match those in the blob plots, illustrating the taxa to which scaffolds were assigned. Circle size indicates length of each scaffold. Not shown here are scaffolds binning to Hymenoptera or to unclassified organisms. Note that for each metagenome library, DNA was obtained from a total of 10 workers from a single colony
Fig. 4
Fig. 4
Pathways for N-waste recycling and amino acid biosynthesis and their distributions across core gut symbionts from 17 Cephalotes species. Various symbiotic gut bacteria convert N wastes into ammonia, incorporate ammonia into glutamate, and synthesize essential amino acids. The proposed model in the upper panel shows sources of the N-waste uric acid (bacterial metabolism via xanthine degradation, bird droppings, host ant waste metabolism via Malpighian tubule delivery) and urea (mammalian urine, uric acid metabolism, and arginine metabolism). Arrows in this panel are colored to reflect taxonomy of the core Cephalotes-specific microbes participating in these steps in multiple metagenomes. Numbers near arrows link particular pathways to bar graphs (below), which in turn plot pathway completeness (i.e., proportion of all genes present) for the dominant core taxa in each metagenome. At left on the lower panel is the phylogeny of Cephalotes species used for metagenomics including a chronogram dating divergence events in these species’ history. The bird and monkey images used in the upper panel were created using Adobe Illustrator CS6 (v. 16.0.0) and the ant image is an Adobe Illustrator clipart image
Fig. 5
Fig. 5
Core symbiont strains possess complete or near complete pathways for N-recycling and amino acid biosynthesis. Heatmap illustrates the proportion of genes present from each N-metabolic pathway across distinct symbiont strains. Coding capacities for strains were inferred from 14 fully sequenced cultured isolate genomes (symbionts from C. varians and C. rohweri) and 11 draft genomes (assembled from C. varians colony PL010 metagenome; identified by the term “Bin” within their names). The maximum likelihood phylogeny of symbiotic bacteria on the left was inferred using an alignment of amino acids encoded by seven phylogenetic marker genes obtained from symbiont genomes, and branch colors are used to illustrate distinct bacterial orders. Red asterisk for urea recycling in the Cephaloticoccus-like Opitutales bin (7-1) indicates that urease genes from the PL010 metagenome binned to Opitutales, but not to the draft genome for the dominant strain. When combined with the likely presence of just one Opitutales strain within the PL010 microbiome (see Results), it is likely that a completely assembled genome would encode all urease genes. Black asterisk for arginine indicates that we examined the completeness of arginine biosynthesis based on the pathway with glutamate as a precursor
Fig. 6
Fig. 6
A limited range of cultured core symbiont strains recycle N in vitro. Results summarize findings from symbionts of five cephalotine ant species, including four from the genus Cephalotes and one from its sister genus Procryptocerus. a Genes and pathways used by specialized gut symbionts to recycle the N-wastes uric acid and urea. The conserved architecture for clusters of symbiont N-recycling genes is illustrated. Red boxes within these pathways represent the metabolic steps assayed for (b). b Shown at left are phylogenies of cultured symbionts subject to metabolic assays in vitro and their closest relatives in the NCBI database, which are highlighted with taxon-specific, colored boxes. Most cultured isolates had 16S rRNA sequences that were identical or highly related to at least one sequence obtained from a Cephalotes ant through culture-independent means. Genomes from such isolates also showed high similarity to abundantly represented scaffolds from our metagenomes (Supplementary Fig. 15). Nodes for cultured symbionts are connected to relevant rows within data tables, where the results of assays for urea production and urea degradation assays are illustrated. Asterisks highlight isolates with a sequenced genome; for each of these, in vitro results matched expectations derived from genome content. Additional symbols used in the urea production table indicate whether allantoin boosted urea production and whether urea production was completely allantoin dependent, and hence likely dependent on uric acid metabolism (e.g., urea can separately be produced through arginine metabolism). Three biological replicates were run as a single trial for 13 symbionts subjected to the urea production assay. For four strains we ran one or two additional trials (Supplementary Data 5). Statistical analyses included a two-way, repeated measures ANOVA to examine an effect of allantoin on urea production, an effect of time, and an interaction between these two factors. Holm–Sidak tests were then used for pairwise comparisons between treatments (e.g., allantoin presence vs. absence) at particular time points, for all trials with a significant effect of treatment or a treatment by time interaction effect

References

    1. Elser JJ, et al. Global analysis of nitrogen and phosphorus limitation of primary producers in freshwater, marine and terrestrial ecosystems. Ecol. Lett. 2007;10:1135–1142. doi: 10.1111/j.1461-0248.2007.01113.x. - DOI - PubMed
    1. Chapin FS. The mineral nutrition of wild plants. Annu. Rev. Ecol. Syst. 1980;11:233–260. doi: 10.1146/annurev.es.11.110180.001313. - DOI
    1. Brune A, Dietrich C. The gut microbiota of termites: digesting the diversity in the light of ecology and evolution. Annu. Rev. Microbiol. 2015;69:145–166. doi: 10.1146/annurev-micro-092412-155715. - DOI - PubMed
    1. Douglas AE. Nutritional interactions in insect-microbial symbioses: aphids and their symbiotic bacteria Buchnera. Annu. Rev. Entomol. 1998;43:17–37. doi: 10.1146/annurev.ento.43.1.17. - DOI - PubMed
    1. Sabree ZL, Kambhampati S, Moran NA. Nitrogen recycling and nutritional provisioning by Blattabacterium, the cockroach endosymbiont. Proc. Natl. Acad. Sci. USA. 2009;106:19521–19526. doi: 10.1073/pnas.0907504106. - DOI - PMC - PubMed

Publication types

LinkOut - more resources