. 2018 Mar 6;8(1):4047.
doi: 10.1038/s41598-018-22459-7.

Chemical & Nano-mechanical Study of Artificial Human Enamel Subsurface Lesions

Affiliations

Chemical & Nano-mechanical Study of Artificial Human Enamel Subsurface Lesions

R Al-Obaidi et al. Sci Rep. .

Abstract

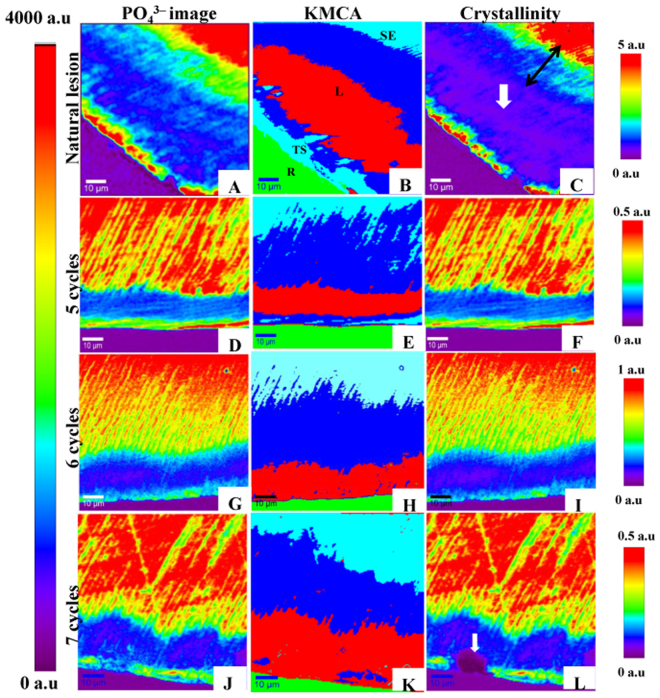
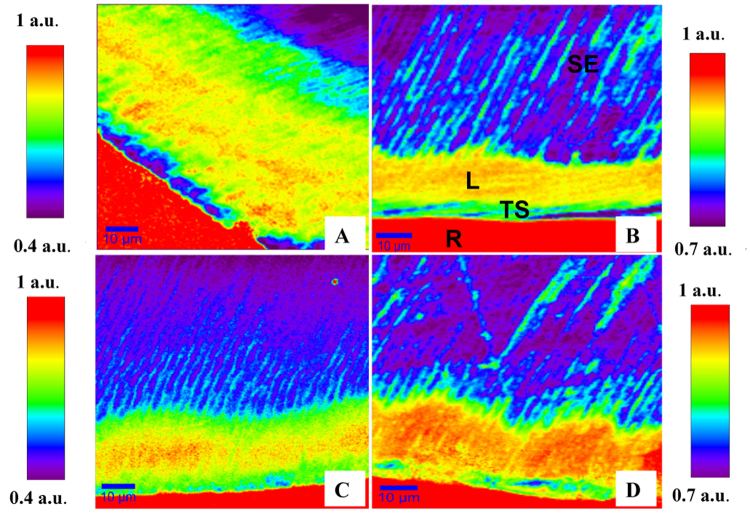
White lesions represent an early phase of caries formation. 20 human sound premolars were subjected to pH cycling procedure to induce subsurface lesions (SLs) in vitro. In addition, 2 teeth with naturally developed white spot lesions (WSLs) were used as references. All specimens characterized by confocal Raman microscopy being used for the first time in examining white & subsurface lesions and providing a high resolution chemical and morphological map based on phosphate peak intensity alterations at 960 cm-1. Nanoindentation technique was used to measure Hardness (H) and Young's modulus (E) of enamel. Phosphate map of examined samples exhibited presence of intact surface layer (ISL) followed by severe depletion in (PO43-) peak in the area corresponding to the body of the lesion. In all examined groups, the mechanical properties of enamel were decreased in lesion area and found to be inversely related to penetration depth of indenter owing to enamel hierarchical structure. By combining the above two techniques, we linked mechanical properties of enamel to its chemical composition and ensured that the two methods are highly sensitive to detect small changes in enamel composition. Further work is required to bring these two excellent tools to clinical application to perceive carious lesions at an early stage of development.


Conflict of interest statement

The authors declare no competing interests.

Figures

Figure 1
Figure 1
The relation between means of lesion depth determined by measuring variations in PO43− peak intensity at 960 cm−1 & number of cycles (C). SD values are represented by error bars. (NL) natural lesion.
Figure 2
Figure 2
Natural lesion versus in-vitro lesions exposed to 5, 6 and 7 cycles. (A,D,G and J) images constructed from phosphate peak intensity at 960 cm−1. Look Up Table (LUT) on the left. (B,E,H and K) K-mean cluster analysis (KMCA) images, green zones are corresponding to embedding resin. (C,F,I, and L) images of crystallinity (phosphate peaks ratio at (960) over (950) cm−1). Individual LUT on the right. Purple zones are corresponding to embedding resin. Crystallinity images are almost following phosphate pattern in the 1st group of images, except for C and L images; where we can observe the presence of purple hues (white solid arrows) in lesion area which indicate total loss of crystallinity in lesion area. (Following symbols in image (B) are valid for all images: SE; sound enamel, L; lesion, TS; tooth surface, R; resin).
Figure 3
Figure 3
(A) Natural lesion versus in-vitro lesions (B,C,D) exposed to 5, 6 and 7 cycles respectively. Images constructed from CO32−/PO43− ratio at (1070 cm−1) over (960 cm−1). Individual LUT on left & right where red hues indicate highest CO32−/PO43− ratio and purple hues represent lowest values of the same ratio. (Following symbols in image B are valid for all images: SE; sound enamel, L; lesion, TS; tooth surface, R; resin).
Figure 4
Figure 4
(A) Optical microscopic image of polished enamel surface with prints of Berkovich tip indenter in lesion zone. (B) A graph demonstrating the nanoindentation load-displacement curves in: 1 sound enamel, 2 intermediate zone & 3 lesion area. The difference in penetration depth (Pd) between the three zones is very obvious; indicating an inverse relationship between the reduction in hardness value and the increase in the depth of penetration. (C and D) bar graphs showing H and E mean values in all zones in: Natural lesion versus artificial lesions after 5, 6 and 7 cycles consecutively. Asterisk (*) shows a statistically significant difference (p < 0.05) between zones connected by bracket within each group. Horizontal bar indicates no significant difference (p > 0.05) among subgroups marked by it.

References

    1. Derks A, Katsaros C, Frencken J, Van’t Hof M, Kuijpers-Jagtman A. Caries-inhibiting effect of preventive measures during orthodontic treatment with fixed appliances. Caries research. 2004;38:413–420. doi: 10.1159/000079621. - DOI - PubMed
    1. Bergstrand, F. & Twetman, S. A review on prevention and treatment of post-orthodontic white spot lesions–evidence-based methods and emerging technologies. The open dentistry journal5 (2011). - PMC - PubMed
    1. Summitt, J. B., Robbins, J. W., Hilton, T. J. & Schwartz, R. S. Fundamentals of operative dentistry: a contemporary approach. (Quintessence Pub., 2006).
    1. Gorelick L, Geiger AM, Gwinnett AJ. Incidence of white spot formation after bonding and banding. American journal of orthodontics. 1982;81:93–98. doi: 10.1016/0002-9416(82)90032-X. - DOI - PubMed
    1. Wang X-J, et al. Characterization of dentin and enamel by use of optical coherence tomography. Applied Optics. 1999;38:2092. doi: 10.1364/AO.38.002092. - DOI - PubMed

Publication types