. 2018 Mar 6;8(1):4100.
doi: 10.1038/s41598-018-22325-6.

Online proton therapy monitoring: clinical test of a Silicon-photodetector-based in-beam PET

Affiliations

Online proton therapy monitoring: clinical test of a Silicon-photodetector-based in-beam PET

Veronica Ferrero et al. Sci Rep. .

Abstract

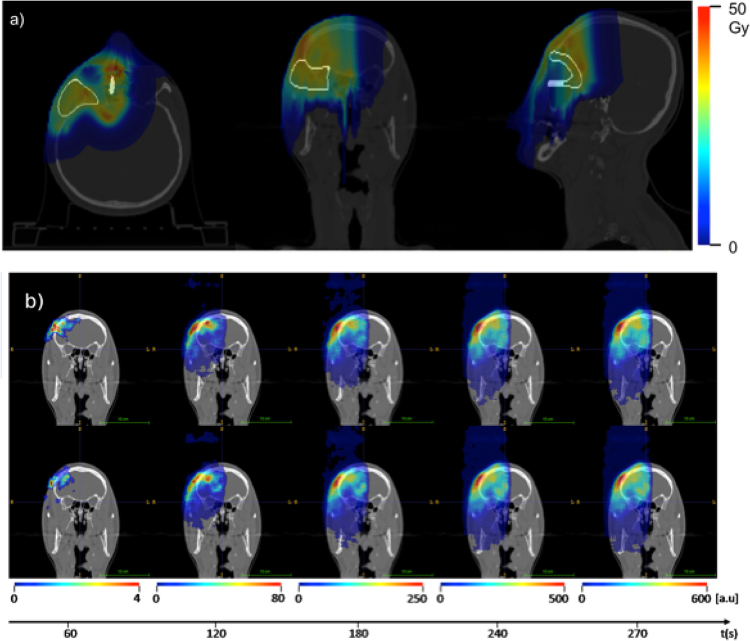
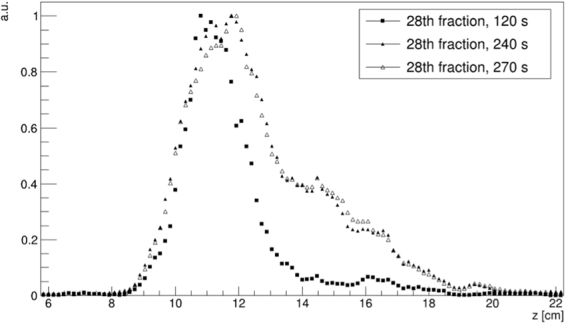
Particle therapy exploits the energy deposition pattern of hadron beams. The narrow Bragg Peak at the end of range is a major advantage but range uncertainties can cause severe damage and require online verification to maximise the effectiveness in clinics. In-beam Positron Emission Tomography (PET) is a non-invasive, promising in-vivo technique, which consists in the measurement of the β+ activity induced by beam-tissue interactions during treatment, and presents the highest correlation of the measured activity distribution with the deposited dose, since it is not much influenced by biological washout. Here we report the first clinical results obtained with a state-of-the-art in-beam PET scanner, with on-the-fly reconstruction of the activity distribution during irradiation. An automated time-resolved quantitative analysis was tested on a lacrimal gland carcinoma case, monitored during two consecutive treatment sessions. The 3D activity map was reconstructed every 10 s, with an average delay between beam delivery and image availability of about 6 s. The correlation coefficient of 3D activity maps for the two sessions (above 0.9 after 120 s) and the range agreement (within 1 mm) prove the suitability of in-beam PET for online range verification during treatment, a crucial step towards adaptive strategies in particle therapy.


Conflict of interest statement

The authors declare no competing interests.

Figures

Figure 1
Figure 1
The INSIDE in-beam PET in one of the CNAO treatment rooms. The mobile support is placed between the horizontal beam line nozzle and the patient bed, ready for acquisition. The beam direction is shown in the picture.
Figure 2
Figure 2
(a) Treatment plan and set up. Axial (left), coronal (centre) and sagittal (right) sections of the patient CT with the planned dose distribution to be delivered in the beam field monitored with the INSIDE in-beam PET system and the Clinical Target Volume (CTV) superimposed in white. (b) Time Evolution of a 2D slice of the detected beam-induced activity superimposed to the patient Computed Ttomography (CT) used for dose planning. The top and bottom rows refer to the first (December, 1st, 2016), and second (December, 2nd, 2016) acquisition days, respectively. The shown images correspond to 3D activity map reconstructions at the end of every minute, starting from the beginning of the treatment. An additional image corresponding to the whole treatment plus 30 s after-treatment is also shown. The image look-up tables refer to different intensity scales because of the different amounts of data integrated during the time intervals.
Figure 3
Figure 3
Reconstructed activity profiles along the beam direction (z) for 1 pixel in the transverse plane (xy), at three different time intervals corresponding to one half of the delivery (120 s), the end of treatment (240 s) and the end of acquisition (270 s). The distributions are normalised to their maximum activity value.
Figure 4
Figure 4
(a) Pearson’s Correlation Coefficient calculated for each couple of PET images, reconstructed every 10 s, as a function of time. (b) Mean difference (black) and standard deviation (white) calculated with the BEV method. (c) Mean difference (black) and standard deviation (white) calculated with the OV method.

References

    1. Zhu X, Fakhri GE. Proton Therapy Verification with PET Imaging. Theranostics. 2013;3(10):731–740. doi: 10.7150/thno.5162. - DOI - PMC - PubMed
    1. Parodi K. On- and off-line monitoring of ion beam treatment. Nuclear Instruments and Methods in Physics Research A. 2016;809:113–9. doi: 10.1016/j.nima.2015.06.056. - DOI
    1. Richter C, et al. First clinical application of a prompt gamma based in vivo proton range verification system. Radiotheraphy & Oncology. 2016;118(2):232–237. doi: 10.1016/j.radonc.2016.01.004. - DOI - PubMed
    1. Paganetti H. Range uncertainties in proton therapy and the role of Monte Carlo simulations. Phys. Med. Biol. 2012;57(11):R99–R117. doi: 10.1088/0031-9155/57/11/R99. - DOI - PMC - PubMed
    1. Fiedler F, et al. On the effectiveness of ion range determination from in-beam PET data. Phys. Med. Biol. 2010;55(7):1989–1998. doi: 10.1088/0031-9155/55/7/013. - DOI - PubMed

Publication types

MeSH terms