

SWPhylo - A Novel Tool for Phylogenomic Inferences by Comparison of Oligonucleotide Patterns and Integration of Genome-Based and Gene-Based Phylogenetic Trees
- PMID: 29511354
- PMCID: PMC5826093
- DOI: 10.1177/1176934318759299
SWPhylo - A Novel Tool for Phylogenomic Inferences by Comparison of Oligonucleotide Patterns and Integration of Genome-Based and Gene-Based Phylogenetic Trees
Abstract
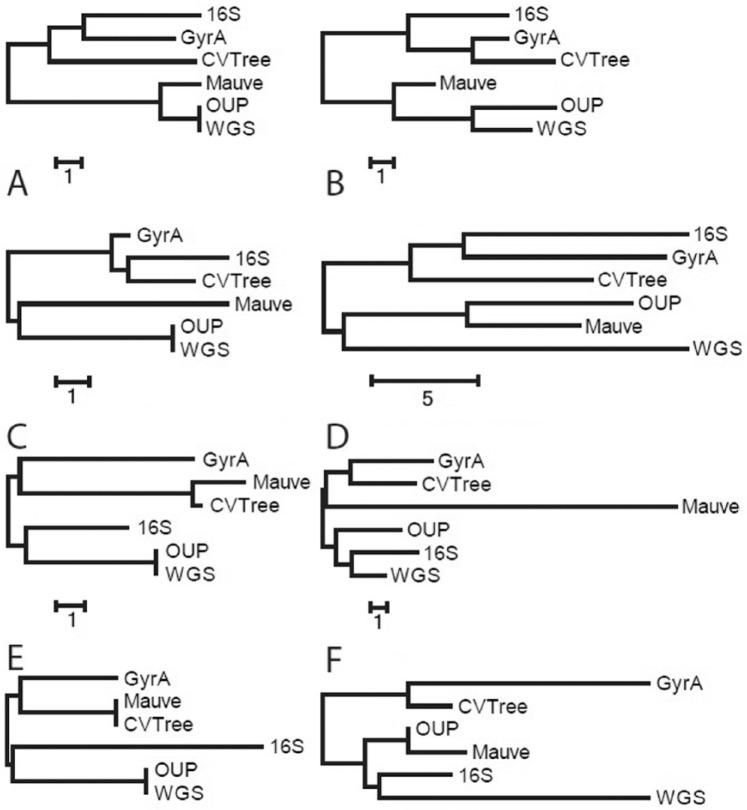
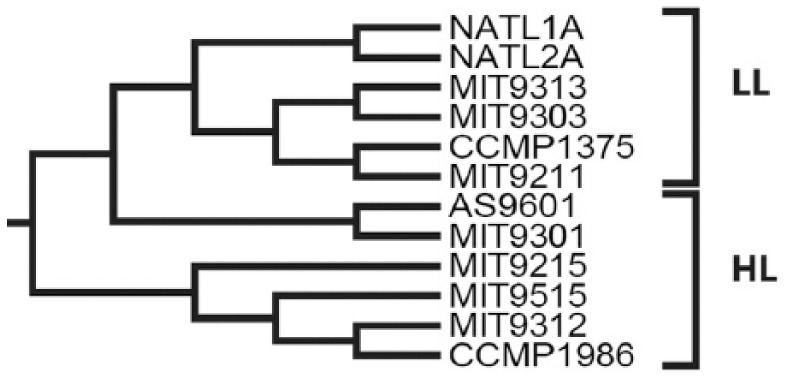
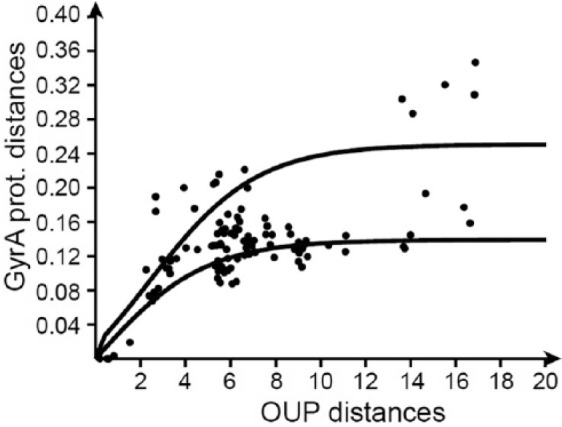
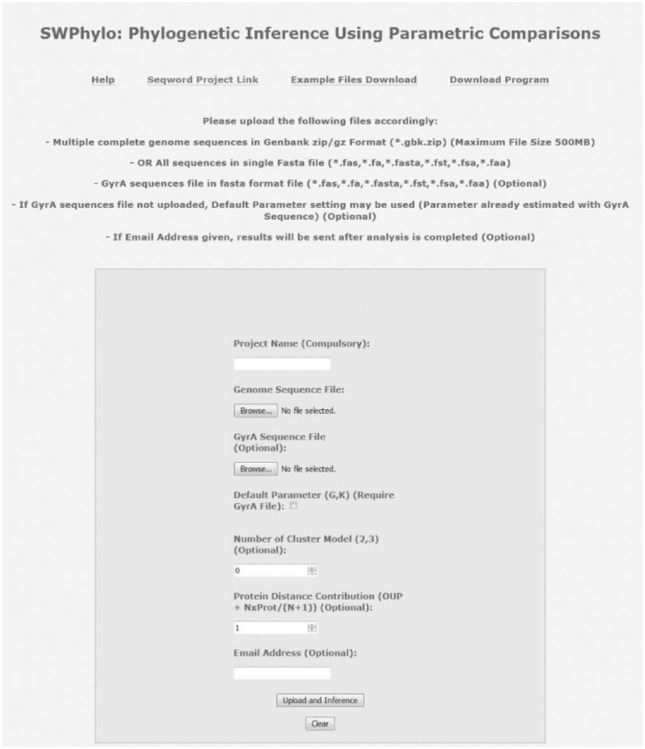
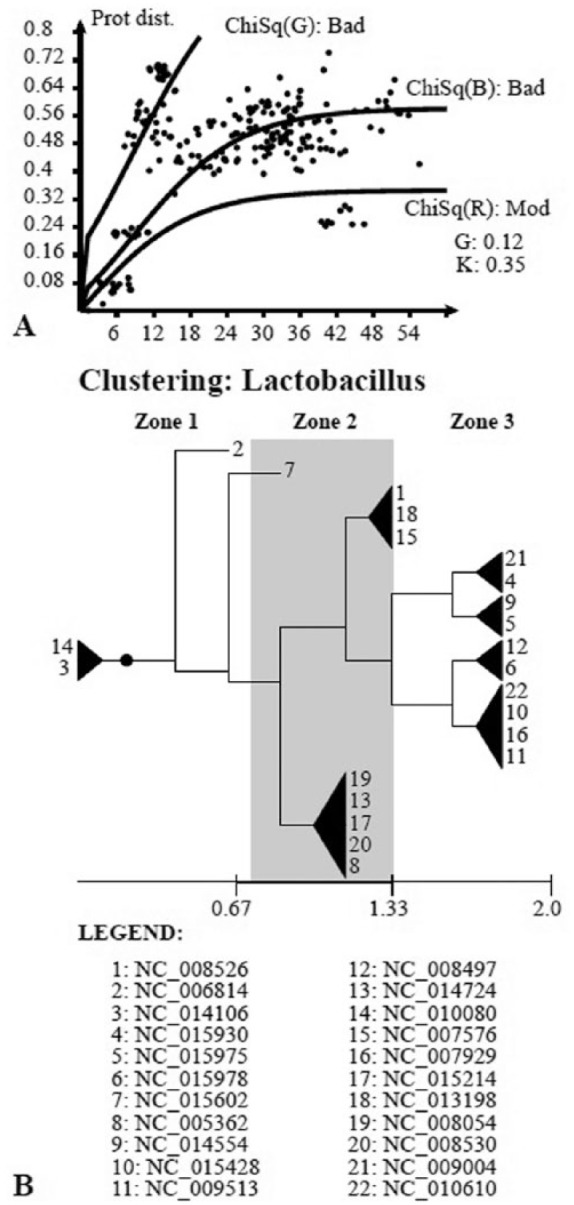
Modern phylogenetic studies may benefit from the analysis of complete genome sequences of various microorganisms. Evolutionary inferences based on genome-scale analysis are believed to be more accurate than the gene-based alternative. However, the computational complexity of current phylogenomic procedures, inappropriateness of standard phylogenetic tools to process genome-wide data, and lack of reliable substitution models which correlates with alignment-free phylogenomic approaches deter microbiologists from using these opportunities. For example, the super-matrix and super-tree approaches of phylogenomics use multiple integrated genomic loci or individual gene-based trees to infer an overall consensus tree. However, these approaches potentially multiply errors of gene annotation and sequence alignment not mentioning the computational complexity and laboriousness of the methods. In this article, we demonstrate that the annotation- and alignment-free comparison of genome-wide tetranucleotide frequencies, termed oligonucleotide usage patterns (OUPs), allowed a fast and reliable inference of phylogenetic trees. These were congruent to the corresponding whole genome super-matrix trees in terms of tree topology when compared with other known approaches including 16S ribosomal RNA and GyrA protein sequence comparison, complete genome-based MAUVE, and CVTree methods. A Web-based program to perform the alignment-free OUP-based phylogenomic inferences was implemented at http://swphylo.bi.up.ac.za/. Applicability of the tool was tested on different taxa from subspecies to intergeneric levels. Distinguishing between closely related taxonomic units may be enforced by providing the program with alignments of marker protein sequences, eg, GyrA.
Keywords: Phylogenomics; bacterial evolution; computational algorithm; evolutionary model; oligonucleotide usage pattern.
Conflict of interest statement
Declaration of conflicting interests:The author(s) declared no potential conflicts of interest with respect to the research, authorship, and/or publication of this article.
Figures


Similar articles
-
k-mer Similarity, Networks of Microbial Genomes, and Taxonomic Rank.mSystems. 2018 Nov 20;3(6):e00257-18. doi: 10.1128/mSystems.00257-18. eCollection 2018 Nov-Dec. mSystems. 2018. PMID: 30505941 Free PMC article.
-
A new fast method for inferring multiple consensus trees using k-medoids.BMC Evol Biol. 2018 Apr 5;18(1):48. doi: 10.1186/s12862-018-1163-8. BMC Evol Biol. 2018. PMID: 29621975 Free PMC article.
-
Phylogenomic analyses data of the avian phylogenomics project.Gigascience. 2015 Feb 12;4:4. doi: 10.1186/s13742-014-0038-1. eCollection 2015. Gigascience. 2015. PMID: 25741440 Free PMC article.
-
Alignment-free inference of hierarchical and reticulate phylogenomic relationships.Brief Bioinform. 2019 Mar 22;20(2):426-435. doi: 10.1093/bib/bbx067. Brief Bioinform. 2019. PMID: 28673025 Free PMC article. Review.
-
BIR Pipeline for Preparation of Phylogenomic Data.Evol Bioinform Online. 2015 Apr 27;11:79-83. doi: 10.4137/EBO.S10189. eCollection 2015. Evol Bioinform Online. 2015. PMID: 25987827 Free PMC article. Review.
Cited by
-
Selection of marker genes for genetic barcoding of microorganisms and binning of metagenomic reads by Barcoder software tools.BMC Bioinformatics. 2018 Aug 30;19(1):309. doi: 10.1186/s12859-018-2320-1. BMC Bioinformatics. 2018. PMID: 30165813 Free PMC article.
-
Alignment- and reference-free phylogenomics with colored de Bruijn graphs.Algorithms Mol Biol. 2020 Apr 7;15:4. doi: 10.1186/s13015-020-00164-3. eCollection 2020. Algorithms Mol Biol. 2020. PMID: 32280365 Free PMC article.
References
-
- Beiko RG. Gene sharing and genome evolution: networks in trees and trees in networks. Biol Philos. 2010;25:659–673.
LinkOut - more resources
Full Text Sources
Other Literature Sources
Molecular Biology Databases
