Review
. 2018 Feb 22:9:1179597218756896.
doi: 10.1177/1179597218756896. eCollection 2018.

Application of a Causal Discovery Algorithm to the Analysis of Arthroplasty Registry Data

Affiliations
Review

Application of a Causal Discovery Algorithm to the Analysis of Arthroplasty Registry Data

Camden Cheek et al. Biomed Eng Comput Biol. .

Abstract

Improving the quality of care for hip arthroplasty (replacement) patients requires the systematic evaluation of clinical performance of implants and the identification of "outlier" devices that have an especially high risk of reoperation ("revision"). Postmarket surveillance of arthroplasty implants, which rests on the analysis of large patient registries, has been effective in identifying outlier implants such as the ASR metal-on-metal hip resurfacing device that was recalled. Although identifying an implant as an outlier implies a causal relationship between the implant and revision risk, traditional signal detection methods use classical biostatistical methods. The field of probabilistic graphical modeling of causal relationships has developed tools for rigorous analysis of causal relationships in observational data. The purpose of this study was to evaluate one causal discovery algorithm (PC) to determine its suitability for hip arthroplasty implant signal detection. Simulated data were generated using distributions of patient and implant characteristics, and causal discovery was performed using the TETRAD software package. Two sizes of registries were simulated: (1) a statewide registry in Michigan and (2) a nationwide registry in the United Kingdom. The results showed that the algorithm performed better for the simulation of a large national registry. The conclusion is that the causal discovery algorithm used in this study may be a useful tool for implant signal detection for large arthroplasty registries; regional registries may only be able to only detect implants that perform especially poorly.

Keywords: Causal discovery; arthroplasty; hip; probabilistic graphical models.


Conflict of interest statement

Declaration of conflicting interests:The author(s) declared no potential conflicts of interest with respect to the research, authorship, and/or publication of this article.

Figures
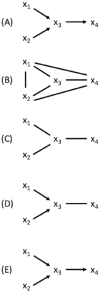
Figure 1.
Figure 1.
Example of causal discovery algorithm PC using 4 variables, x1, x3, x3, and x4, assuming that x1 and x2 are independent, x1 and x4 are conditionally independent given x3, x2, and x4 are conditionally independent given x3, x1 is a cause of x3, x2 is a cause of x3, and x3 is a cause of x4. This is illustrated as a DAG in (A). The algorithm has 3 steps. Step 1 consists of constructing a fully connected undirected graph (B). Step 2 consists of removing all edges where the data do not support a direct cause between 2 nodes. The edge between x1 and x2 is removed because they are independent. The edge between x1 and x4 is removed because x1 and x4 are conditionally independent given x3. This means that if x3 is fixed, any change in x1 does not cause a change in x4. Similarly, the edge between x2 and x4 is removed, resulting in the DAG shown in (C). Step 3 determines the direction of the edges remaining at the end of step 2. Directed edges from x1 to x3 and from x2 to x3 are determined because x3 must be a collider node due to x1 and x2 being independent (the “collider test” for edge direction), resulting in (D). The “from collider test” is used to determine that the edge from x3 to x4 is directed from x3 to x4 (E). Observe that the PC algorithm reconstructed (E) from the statistical independence assumptions implied by the DAG in (A). DAG indicates directed acyclic graph.
Figure 2.
Figure 2.
Causal diagram for simulated data. The simulation included 3 variables: (1) implant, (2) sex, and (3) time to first revision (TTR). Causal relationships are indicated by directed edges between nodes.
Figure 3.
Figure 3.
Proportion of reconstructed graphs with an edge between implant and TTR for a given effect size. Figure panels 3A and B use a registry size of 799 revised cases, and figure panels 3C and D use a registry size of 20 800 revised cases. Figure panels 3A and 3C use a pI,F and pI,M of 0.02, and figure panels 3B and 3D use a pI,F and pI,M of 0.04. Error bars represent 95% confidence interval. TTR indicates time to first revision.
Figure 4.
Figure 4.
Proportion of reconstructed graphs with an edge between implant and TTR for a given number of revised cases. Both panels use an effect size (EI) of 2.0. Figure panel 4A uses a pI,F and pI,M of 0.02 and figure panel 4B uses a pI,F and pI,M of 0.04. Error bars represent 95% confidence interval. TTR indicates time to first revision.
Figure 5.
Figure 5.
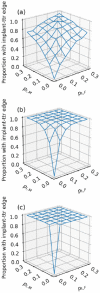
Proportion of reconstructed graphs with an edge between implant and TTR for a given pI,F and pI,M. Number of revised cases is set at 799 for all panels. Effect size (EI) is set at 1.5, 2.0, and 4.0 in figure panels 5A to C, respectively. TTR indicates time to first revision.
Figure 6.
Figure 6.
Proportion of reconstructed graphs with an edge between implant and TTR for a given pI,F and pI,M. Number of revised cases is set at 20 863 for all panels. Effect size (EI is set at 1.25, 1.5, and 2.0 in figure panels 6A to C, respectively). TTR indicates time to first revision.

References

    1. Kurtz SM, Ong KL, Lau E, Bozic KJ. Impact of the economic downturn on total joint replacement demand in the United States: updated projections to 2021. J Bone Joint Surg Am. 2014;96:624–630. - PubMed
    1. Hughes RE, Batra A, Hallstrom BR. Arthroplasty registries around the world: valuable sources of hip implant revision risk data. Curr Rev Musculoskel Med. 2017;10:240–252. - PMC - PubMed
    1. Labek G, Neumann D, Agreiter M, Schuh R, Böhler N. Impact of implant developers on published outcome and reproducibility of cohort-based clinical studies in arthroplasty. J Bone Joint Surg Am. 2011;93:55–61. - PubMed
    1. Labek G, Sekyra K, Pawelka W, et al. Outcome and reproducibility of data concerning the oxford unicompartmental knee arthroplasty: a structured literature review including arthroplasty registry data. Acta Orthop. 2011;82:131–135. - PMC - PubMed
    1. de Steiger RN, Miller LN, Davidson DC, Ryan P, Graves SE. Joint registry approach for identification of outlier prostheses. Acta Orthop. 2013;84:348–352. - PMC - PubMed

LinkOut - more resources