. 2018 Apr 5;556(7699):57-63.
doi: 10.1038/nature26155. Epub 2018 Feb 28.

Evolved Cas9 variants with broad PAM compatibility and high DNA specificity

Affiliations

Evolved Cas9 variants with broad PAM compatibility and high DNA specificity

Johnny H Hu et al. Nature. .

Abstract

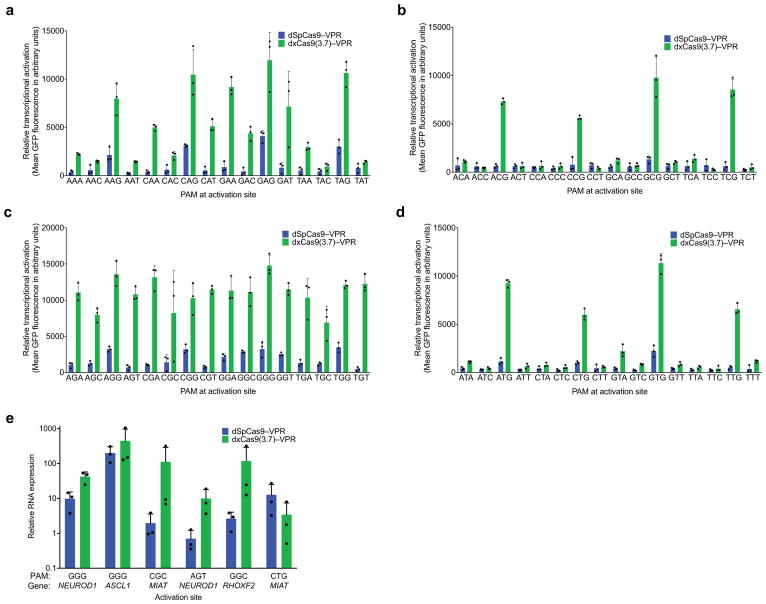
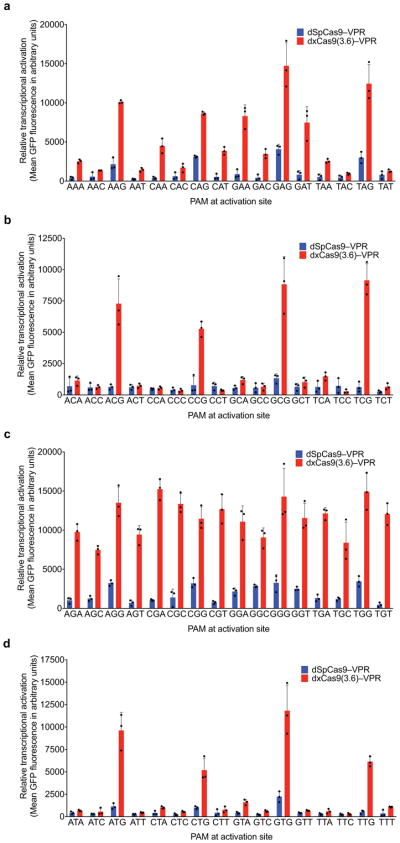
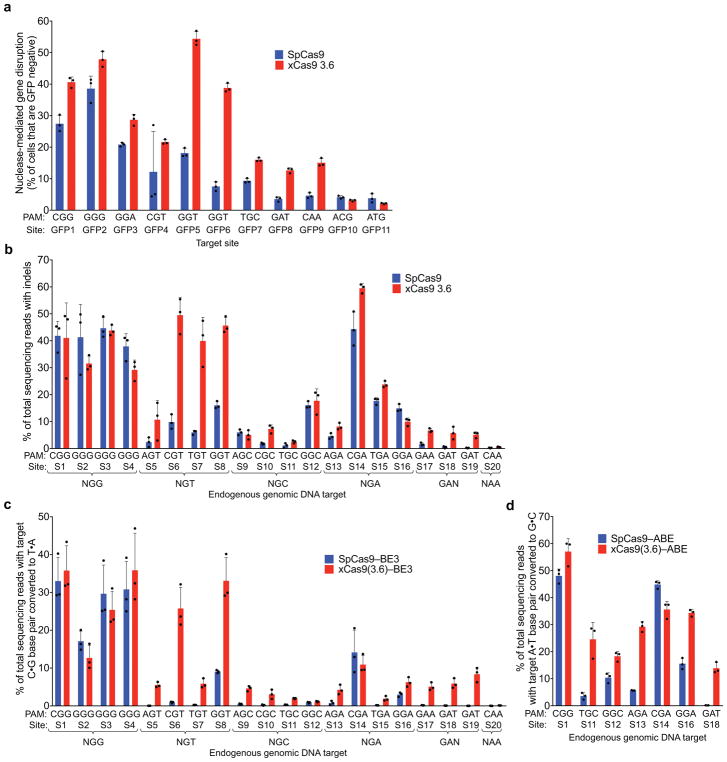
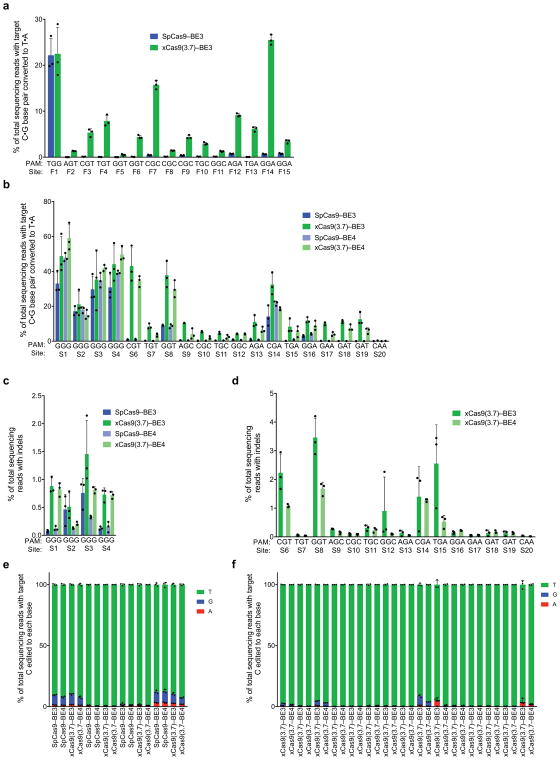
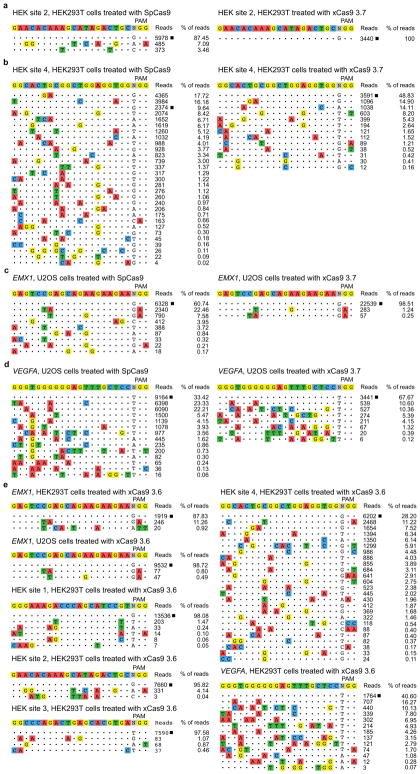
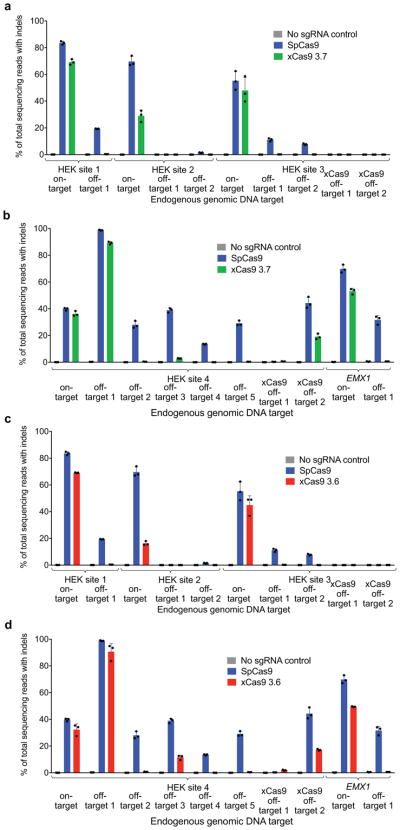
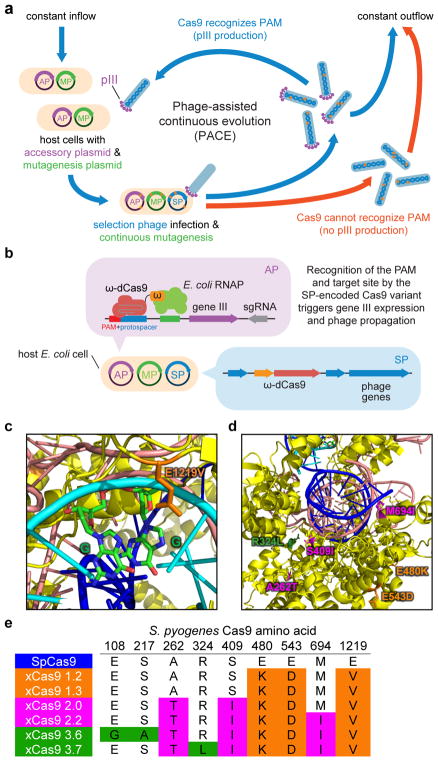
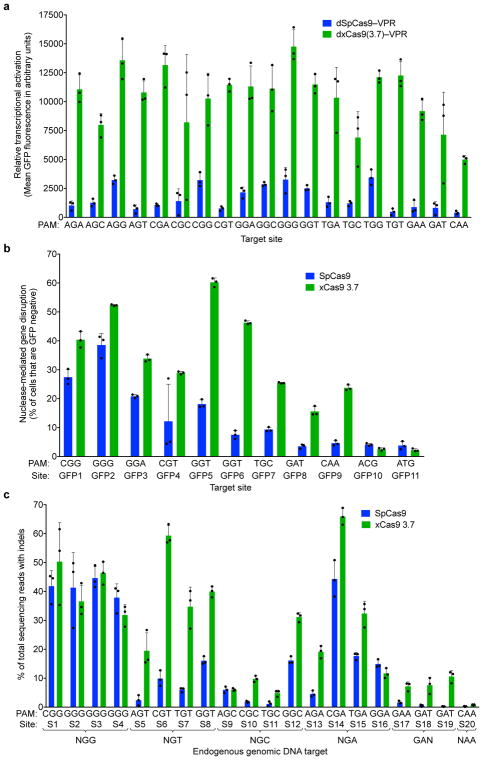
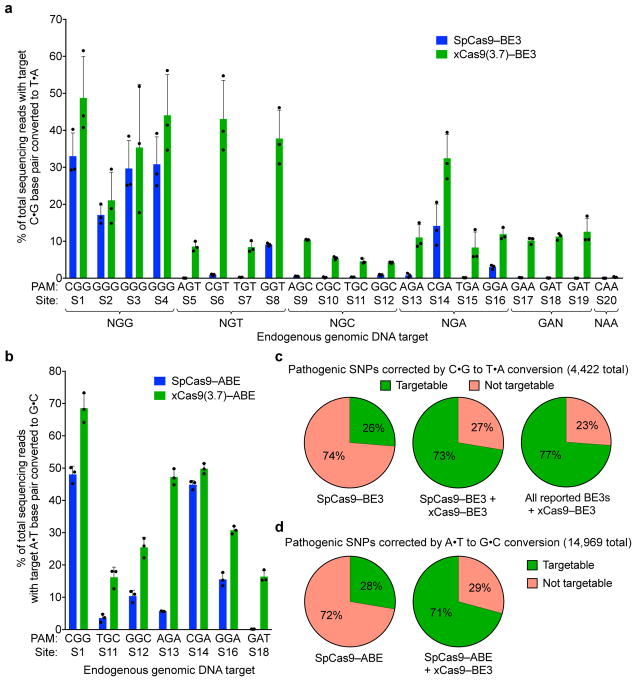
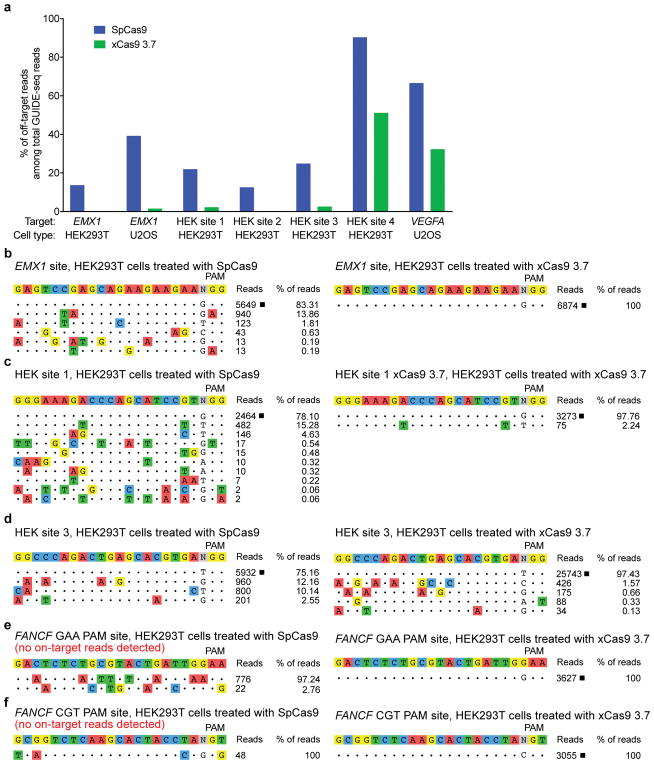
A key limitation of the use of the CRISPR-Cas9 system for genome editing and other applications is the requirement that a protospacer adjacent motif (PAM) be present at the target site. For the most commonly used Cas9 from Streptococcus pyogenes (SpCas9), the required PAM sequence is NGG. No natural or engineered Cas9 variants that have been shown to function efficiently in mammalian cells offer a PAM less restrictive than NGG. Here we use phage-assisted continuous evolution to evolve an expanded PAM SpCas9 variant (xCas9) that can recognize a broad range of PAM sequences including NG, GAA and GAT. The PAM compatibility of xCas9 is the broadest reported, to our knowledge, among Cas9 proteins that are active in mammalian cells, and supports applications in human cells including targeted transcriptional activation, nuclease-mediated gene disruption, and cytidine and adenine base editing. Notably, despite its broadened PAM compatibility, xCas9 has much greater DNA specificity than SpCas9, with substantially lower genome-wide off-target activity at all NGG target sites tested, as well as minimal off-target activity when targeting genomic sites with non-NGG PAMs. These findings expand the DNA targeting scope of CRISPR systems and establish that there is no necessary trade-off between Cas9 editing efficiency, PAM compatibility and DNA specificity.


Conflict of interest statement

The authors declare competing financial interests: J.H.H. and D.R.L. have filed patent applications on this work. D.R.L. is a consultant and co-founder of Editas Medicine, Beam Therapeutics, and Pairwise Plants, companies that use genome editing technologies. The authors declare no competing non-financial interests.

Figures

Extended Data Figure 1
Extended Data Figure 1. Optimization of Cas9 PACE
Luciferase expression in E. coli was used as a proxy of gene III expression during efforts to link Cas9 binding to gene expression for PACE. a, b, Seven guide RNAs targeting the luciferase reporter (G1–G7′, see Supplementary Table 1), as well as a scrambled guide RNA negative control (G0) were tested without dCas9 (white bars) and with ω–dCas9 (a) or dCas9–ω (b) fusions (grey bars). c, Tests of seven different linkers between ω and dCas9. See Supplementary Table 2 for linker sequences. d, Evolution of ω–dCas9 on an NGG PAM site in PACE yielded variants (PACE1, PACE2, and PACE3) that were tested in comparison with canonical (“wt”) ω–dCas9, ω tethered to PACE1 dCas9, and the I12N ω mutant tethered to canonical dCas9. Values and error bars reflect the mean and s.d. of n=3 biologically independent samples.
Extended Data Figure 2
Extended Data Figure 2. PAM profiling of xCas9 variants
a, A plasmid library containing a protospacer with all possible NNN PAM sequences and a spectinomycin resistance gene was electroporated into E. coli along with a plasmid expressing SpCas9 or the xCas9 variant shown in separate experiments. PAMs that are cleaved are depleted from the library when plated on media containing spectinomycin. HTS of the library before versus after selection enables quantification of the change in library composition, resulting in a sequence logo for the PAM preference of SpCas9 (left) and xCas9 3.7 (right). b, c, PAM depletion scores of Cas9 variants from spectinomycin selection in E. coli, calculated as described previously, with 1.0 representing complete cleavage of that PAM sequence. Scores for NGN, NNG, GAA, GAT, and CAA are shown in (b) while the rest of the PAM sequences are shown in (c).
Extended Data Figure 3
Extended Data Figure 3. Transcriptional activation of reporter site PAM libraries with xCas9
Transcriptional activation by dSpCas9–VPR and dxCas9–VPR variants, transfected as plasmids, on GFP reporter plasmids containing different PAM sites in HEK293T cells. a, Earlier generations of xCas9 variants were tested on the R1 site with the NGG, NNN, or NNNNN PAM libraries. Values and error bars reflect the mean and s.d. of n=3 biologically independent samples. b, c, Transcriptional activators dxCas9(3.6)–VPR and dxCas9(3.7)–VPR were tested on two different protospacer reporters, R1 in (a) and R2 in (b), containing adjacent NGG, NNN, or NNNNN PAM libraries. Values and error bars reflect the mean and s.d. of n=3 biologically independent samples.
Extended Data Figure 4
Extended Data Figure 4. Transcriptional activation with xCas9 2.0
a–d, The transcriptional activator dxCas9(2.0)–VPR was tested on the R1 protospacer (Extended Data Fig. 3 and Supplementary Table 8) with each of the 64 possible NNN PAMs (NAN, NCN, NGN, and NTN) in HEK293T cells. Values and error bars reflect the mean and s.d. of n=3 biologically independent samples.
Extended Data Figure 5
Extended Data Figure 5. Transcriptional activation with xCas9 3.7 on all 64 NNN PAM sites and endogenous gene activation in human cells
a–d, The transcriptional activator dxCas9(3.7)–VPR was tested on the R1 protospacer (Extended Data Fig. 3 and Supplementary Table 8) with each of the 64 possible NNN PAMs (NAN, NCN, NGN, and NTN) in HEK293T cells. e, Endogenous gene activation was tested using both dSpCas9–VPR and dxCas9(3.7)–VPR to activate expression of the NEUROD1, ASCL1, MIAT, or RHOXF2 at six total sites. RNA expression as measured by RT-qPCR was compared to background expression levels for each gene (measured in the control with no sgRNA) and was normalized to ACTB expression. Values and error bars reflect the mean and s.d. of n=3 biologically independent samples. Target sites are in Supplementary Table 9.
Extended Data Figure 6
Extended Data Figure 6. Transcriptional activation with xCas9 3.6 on all 64 NNN PAM sites
a–d, The transcriptional activator dxCas9(3.6)–VPR was tested on the R1 protospacer (Extended Data Fig. 3 and Supplementary Table 8) with each of the 64 possible NNN PAMs (NAN, NCN, NGN, and NTN) in HEK293T cells. Values and error bars reflect the mean and s.d. of n=3 biologically independent samples.
Extended Data Figure 7
Extended Data Figure 7. Genomic DNA cleavage and base editing by evolved xCas9 3.6
a, Genomic DNA cleavage in HEK293-GFP cells containing a genomically integrated GFP gene by SpCas9 or xCas9 3.6, transfected as plasmids. After 5 days, the cells were analyzed for loss of GFP fluorescence by flow cytometry. Sequences for all target sites are listed in Supplementary Table 11. b, DNA cleavage of endogenous genomic DNA sites with a variety of NGG and non-NGG PAMs by SpCas9 and xCas9 3.6 in HEK293T cells. Indel rates were measured by HTS 5 days after plasmid transfection. Sequences for all target sites are listed in Supplementary Table 12. c, 20 sites containing NG, GAA, GAT, or CAA PAM sites were tested for C•G to T•A base editing in HEK293T cells by SpCas9–BE3 or xCas9(3.6)–BE3. The C•G to T•A conversion frequency by HTS at the most efficiently edited base 3 days after plasmid transfection is shown. d, Of the 20 sites in (c), seven contained an A in the canonical window for ABE editing and were tested for A•T to G•C base editing by SpCas9–ABE and xCas9(3.6)–ABE. The A•T to G•C conversion frequency by HTS at the most efficiently edited base 5 days after plasmid transfection is shown. Values and error bars reflect the mean and s.d. of n=3 biologically independent samples. Complete HTS results across the protospacer are provided in Supplementary Table 14.
Extended Data Figure 8
Extended Data Figure 8. Negative controls lacking guide RNA for nuclease and base editing experiments
To verify genomic DNA cleavage and base editing results, the same sites were sequenced after treatment with SpCas9 nuclease, SpCas9-BE3, or SpCas9-ABE but without any sgRNA. a, Indel rates at endogenous target sites 5 days after treatment of HEK293T cells with SpCas9. b, Target C•G to T•A conversion 3 days after treatment of HEK293T cells with SpCas9-BE3. c, Target A•T to G•C base conversion 5 days after treatment of HEK293T cells with SpCas9-ABE. Values and error bars reflect the mean and s.d. of n=3 biologically independent samples. Complete HTS results across the protospacer are provided in Supplementary Table 14.
Extended Data Figure 9
Extended Data Figure 9. Cytidine base editing at 15 additional genomic sites and xCas9 base editing with the BE4 architecture
a, Base editing by SpCas9–BE3 and xCas9(3.7)–BE3 at 15 sites within the FANCF gene in HEK293T cells. The C•G to T•A conversion frequency at the most efficiently edited base 3 days after plasmid transfection is shown. b, Test of xCas9 3.7 in the BE4 architecture on the same sites tested in Fig. 3. The C•G to T•A conversion frequency in HEK293T cells at the most efficiently edited base 3 days after plasmid transfection is shown. c, d, Indel frequency following treatment with BE3 or BE4 variants targeting sites with NGG PAMs (c) and non-NGG PAMs (d). e, f, Product distribution among edited DNA sequence reads (reads in which the target C is mutated) following treatment with BE3 or BE4 variants targeting sites with NGG PAMs (e) and non-NGG PAMs (f). Since SpCas9 has minimal activity on non-NGG PAM sites, only xCas9(3.7)–BE3 and xCas9(3.7)–BE4 data is compared on non-NGG PAM sites. Values and error bars reflect the mean and s.d. of n=3 biologically independent samples. Target sites are in Supplementary Table 12.
Extended Data Figure 10
Extended Data Figure 10. Additional characterization of xCas9 3.7 and xCas9 3.6 by GUIDE-seq
In addition to the GUIDE-seq data shown in Fig. 4, two additional sites in HEK293T cells (a, b) and two sites in U2OS cells (c, d) were analyzed after treatment with SpCas9 and xCas9 3.7. e, All six GUIDE-seq sites with an NGG PAM that were tested with SpCas9 and xCas9 3.7 in HEK293T and U2OS cells were also tested with xCas9 3.6. On-target reads (□) and off-target reads for all sites are shown. Target sequences are listed in Supplementary Table 15.
Extended Data Figure 11
Extended Data Figure 11. Validation by high-throughput sequencing of GUIDE-seq results
The most frequent off-target sites identified by GUIDE-seq were verified by HTS of genomic DNA following treatment of HEK293T cells with SpCas9 or xCas9 3.7 (a, b), or following treatment with SpCas9 or xCas9 3.6 (c, d). New sites with non-NGG PAMs that were identified as xCas9 off-target sites were also analyzed in (a–d). Values and error bars reflect the mean and s.d. of n=3 biologically independent samples. Target sequences are in Supplementary Table 16.
Figure 1
Figure 1. Phage-assisted continuous evolution (PACE) of Cas9 variants with broadened PAM compatibility
a, PACE takes place in a fixed-volume “lagoon” that is continuously diluted with fresh host E. coli cells. Upon infection, each selection phage (SP) that encodes a Cas9 variant capable of binding the target PAM and protospacer on the accessory plasmid (AP) induces expression of gene III, resulting in infectious progeny phage that propagate the active Cas9 variant in subsequent host cells. b, Anatomy of a phage-infected host cell during PACE. The host cell carries the AP, which links Cas9 target DNA binding to phage propagation, and the mutagenesis plasmid (MP), which elevates mutagenesis during PACE. c, d, The crystal structure of SpCas9 with the location of xCas9 mutations shown. e, Genotypes of some evolved xCas9 variants, colored by evolution stage. See Supplementary Table 5 for 95 xCas9 variant genotypes.
Figure 2
Figure 2. Transcriptional activation and genomic DNA cleavage by evolved xCas9 3.7 in human cells
a, Transcriptional activation by dSpCas9–VPR and dxCas9(3.7)–VPR targeting GFP reporter plasmids containing the same protospacer but different PAM sites in HEK293T cells. b, Genomic DNA cleavage in HEK293-GFP cells containing a genomically integrated GFP reporter gene by SpCas9 or xCas9 3.7. After 5 days, the cells were analyzed for loss of GFP fluorescence by flow cytometry. c, DNA cleavage of endogenous genomic DNA sites with NGG and non-NGG PAMs by SpCas9 and xCas9 3.7 in HEK293T cells. Indel rates were measured by HTS 5 days after plasmid transfection. Values and error bars reflect the mean and s.d. of n=3 biologically independent samples. Target sites are in Supplementary Tables 8, 11, and 12.
Figure 3
Figure 3. Cytidine and adenine base editing by xCas9
a, The C•G to T•A conversion frequencies for 20 endogenous genomic loci in HEK293T cells at the most efficiently edited base 3 days after plasmid transfection are shown. b, The A•T to G•C conversion frequencies for seven endogenous genomic loci in HEK293T cells at the most efficiently edited base 5 days after plasmid transfection are shown. Values and error bars in (a) and (b) reflect the mean and s.d. of n=3 biologically independent samples. See Supplementary Table 14 for complete HTS results across the protospacer. c, Fraction of T•A to C•G pathogenic SNPs in ClinVar that, in principle, can be corrected by SpCas9–BE3 (left), SpCas9–BE3 + xCas9(3.7)–BE3 (middle), or xCas9(3.7)–BE3 + all BE3 variants reported to date (right). d, Fraction of G•C to A•T pathogenic SNPs in ClinVar that, in principle, can be corrected by SpCas9–ABE (left) or SpCas9–ABE + xCas9(3.7)–ABE (right).
Figure 4
Figure 4. Off-target editing analysis of xCas9
a, GUIDE-seq was performed on SpCas9 and xCas9 3.7 nucleases. Six endogenous genomic sites with NGG PAMs were tested in HEK293T or U2OS cells. The percentage of off-target sequencing reads relative to total reads are shown. b–d, All GUIDE-seq on-target reads (□) and off-target reads for three sites in HEK293T cells are shown for SpCas9 and xCas9 3.7. See Extended Data Fig. 10 for additional GUIDE-seq results. e, f, GUIDE-seq results for two endogenous genomic non-NGG PAM sites in HEK293T cells. No on-target GUIDE-seq reads (□) were detected for SpCas9 at either of these non-NGG sites. See Extended Data Fig. 10 for GUIDE-seq analysis of xCas9 3.6 and Extended Data Fig. 11 for HTS validation of GUIDE-seq results. Target sequences are listed in Supplementary Table 15.

Comment in

Similar articles

Cited by

References

    1. Doudna JA, Charpentier E. Genome editing. The new frontier of genome engineering with CRISPR-Cas9. Science. 2014;346:1258096. doi: 10.1126/science.1258096. - DOI - PubMed
    1. Hsu PD, Lander ES, Zhang F. Development and applications of CRISPR-Cas9 for genome engineering. Cell. 2014;157:1262–1278. doi: 10.1016/j.cell.2014.05.010. - DOI - PMC - PubMed
    1. Mitsunobu H, Teramoto J, Nishida K, Kondo A. Beyond Native Cas9: Manipulating Genomic Information and Function. Trends Biotechnol. 2017;35:983–996. doi: 10.1016/j.tibtech.2017.06.004. - DOI - PubMed
    1. Komor AC, Kim YB, Packer MS, Zuris JA, Liu DR. Programmable editing of a target base in genomic DNA without double-stranded DNA cleavage. Nature. 2016;533:420–424. doi: 10.1038/nature17946. - DOI - PMC - PubMed
    1. Gaudelli NM, et al. Programmable base editing of A*T to G*C in genomic DNA without DNA cleavage. Nature. 2017;551:464–471. doi: 10.1038/nature24644. - DOI - PMC - PubMed

Publication types