. 2018 Apr 5;556(7699):122-125.
doi: 10.1038/nature26153. Epub 2018 Feb 28.

Structure of the insulin receptor-insulin complex by single-particle cryo-EM analysis

Affiliations

Structure of the insulin receptor-insulin complex by single-particle cryo-EM analysis

Giovanna Scapin et al. Nature. .

Abstract

The insulin receptor is a dimeric protein that has a crucial role in controlling glucose homeostasis, regulating lipid, protein and carbohydrate metabolism, and modulating brain neurotransmitter levels. Insulin receptor dysfunction has been associated with many diseases, including diabetes, cancer and Alzheimer's disease. The primary sequence of the receptor has been known since the 1980s, and is composed of an extracellular portion (the ectodomain, ECD), a single transmembrane helix and an intracellular tyrosine kinase domain. Binding of insulin to the dimeric ECD triggers auto-phosphorylation of the tyrosine kinase domain and subsequent activation of downstream signalling molecules. Biochemical and mutagenesis data have identified two putative insulin-binding sites, S1 and S2. The structures of insulin bound to an ECD fragment containing S1 and of the apo ectodomain have previously been reported, but details of insulin binding to the full receptor and the signal propagation mechanism are still not understood. Here we report single-particle cryo-electron microscopy reconstructions of the 1:2 (4.3 Å) and 1:1 (7.4 Å) complexes of the insulin receptor ECD dimer with insulin. The symmetrical 4.3 Å structure shows two insulin molecules per dimer, each bound between the leucine-rich subdomain L1 of one monomer and the first fibronectin-like domain (FnIII-1) of the other monomer, and making extensive interactions with the α-subunit C-terminal helix (α-CT helix). The 7.4 Å structure has only one similarly bound insulin per receptor dimer. The structures confirm the binding interactions at S1 and define the full S2 binding site. These insulin receptor states suggest that recruitment of the α-CT helix upon binding of the first insulin changes the relative subdomain orientations and triggers downstream signal propagation.


Conflict of interest statement

The authors declare they have no competing interests.

Figures
Extended Data Figure 1
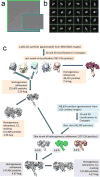
Extended Data Figure 1. Data collection and processing
a, Representative micrograph for the IR:insulin complex. Images were collected on a Thermo-Fisher Krios equipped with an energy filter and a Gatan K2 Counting camera; the magnification was set to 105,000×, with a calibrated pixelsize of 1.10 Å. b, Representative 2D class averages as calculated with Cryosparc. c, Schematic diagram of the data processing.
Extended Data Figure 2
Extended Data Figure 2. Map of Class 1 reconstructed using C2 symmetry to a resolution of 4.3 Å
a, Gold standard FSC curve from Cryosparc. b, Euler angle orientation distribution from Cryosparc. c, Gold standard FSC curve as calculated in RELION. d, Plot of the global half-map FSC (solid red line) and spread of directional resolution values (+/− 1σ from mean, green dotted lines; the blue bars are a histogram of 100 such values evenly sampled over the 3D FSC. e, Local resolution distribution (as calculated in Cryosparc). f, selected areas from the Class 1 C2 map at a resolution of 4.3 Å (map contoured at 12σ). Left, individual β-strands in the L2 region are well separated; Center: bulky side chains are visible in the electron density; Right: density for the L1 β-barrel.
Extended Data Figure 3
Extended Data Figure 3. Map of Class 1 reconstructed using C1 symmetry to a resolution of 4.7 Å
a, Gold standard FSC curve from Cryosparc. b, Euler angle orientation distribution from Cryosparc. c, Gold standard FSC curve as calculated in RELION. d, Plot of the global half-map FSC (solid red line) and spread of directional resolution values (+/− 1σ from mean, green dotted lines; the blue bars are a histogram of 100 such values evenly sampled over the 3D FSC. e, Local resolution distribution (as calculated in Cryosparc).
Extended Data Figure 4
Extended Data Figure 4. Insulin binding and crystallographic S2 site
a, Map of the Class 1 structure obtained without applying C2 symmetry, with the IR model shown as a cartoon. The map is asymmetric and only one of the FnIII-2 sub domains is clearly visible. b, Positioning of the FnIII-2 sub domain allows for analyzing the relative position of the bound insulin (blue) and the proposed S2 site (shown as spheres, residues selected according to: the insulin is between 55 and 62 Å away, and on the opposite side of the proposed S2. c, Overlay of free insulin (1ZNI) to the insulin bound to IR.
Extended Data Figure 5
Extended Data Figure 5. IR sample characterization
a, Coomassie stained SDS-PAGE gel. The protein was solubilized in PBS at pH=7.2 and run on a 4-12% Bis-Tris gel in 1× MOPS. Molecular weight markers are labelled. Bands corresponding to the α- and β-chains are indicated. This experiment was only run once to confirm sample quality was as reported by R&D Systems. For gel source data, see Supplementary Figure 1. b, CryoEM density for the un-symmetrized map (4.7 Ang resolution) countered at 6σ. Density that can be attributed to the second FnIII-2 domain (blue arrow) as well as one of the FnIII-3 domains (red arrow) is visible, but it is not of sufficient quality for building the model.
Extended Data Figure 6
Extended Data Figure 6. Map of Class 2 reconstructed using C1 symmetry to a resolution of 7.4 Å
a, Gold standard FSC curve from Cryosparc. b, Euler angle orientation distribution from Cryosparc. c, Gold standard FSC curve as calculated in RELION. d, Plot of the global half-map FSC (solid red line) and spread of directional resolution values (+/− 1σ from mean, green dotted lines; the blue bars are a histogram of 100 such values evenly sampled over the 3D FSC. e, Local resolution distribution (as calculated in Cryosparc).
Extended Data Figure 7
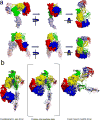
Extended Data Figure 7. Comparison between the crystallographic and the cryoEM dimer
a, The top panel shows three different views of the cryoEM dimer, related by the 90° rotation shown in the figure. This is the surface (for one monomer) and cartoon (for the other) representation of the coordinates fitted to the un-symmetrized, 4.7 Å map: in this model one of the FnIII-2 subdomains is visible. Both monomers are colored according to the subdomains (L1, blue; CR, red; L2, yellow; FnIII-1, green, FnIII-2, light blue). The bottom panel shows three corresponding views for the crystallographic dimer. One monomer is shown as surface, the other as a cartoon; both are colored according to the subdomains (as for the cryoEM dimer; the additional FnIII-3 is colored in light purple). The relative arrangement of the two monomers in the cryoEM and crystallographic dimers are completely different. b, If the crystallographic IR dimer (left panel) represents the biological apo IR dimer, the transition to the insulin bound dimer (right panel) would imply a putative intermediate state shown in the middle panel: in this state the large conformational changes required to accommodate the αCT helix (orange ribbon) and the insulin (white ribbon), and to allow them to engage the S2 site (black spheres) would require disruption of the extensive surface interface between L1 and FnIII-2′/3′ and L2-FnIII-1′ interactions. In the middle and right panel the αCT helix and the insulin are from the cryo-EM structure.
Extended data Figure 8
Extended data Figure 8. Comparison between the bound and unbound IR monomer
Transition from the unliganded form (magenta, 4ZXB monomer) to the bound form (green, cryo-EM structure) for the IR monomer; this transition can be described as two rotations with respect to the linker regions identified by the black arrows. The α-CT helix is shown as cartoon.
Figure 1
Figure 1. Structure of the Insulin Receptor dimer
a, Domain organization of the full length IR. The inter-monomer disulfide bonds, are shown as black lines; the intra-monomer “signaling bridge” is shown as an orange line. b, CryoEM density map for Class 1 with the IR sub-domains fitted to the density; one monomer is yellow, the other is color coded as in a. Density identified by the red arrows can be attributed to the insulin and αCT helix. c, Close-up of density with insulin and α-CT helix fitted.
Figure 2
Figure 2. Class 1 and Class 2 dimers
a, Side and top view of the two classes identified during 3D reconstruction. b CryoEM map for the Class 2 showing density for the α-CT helix and insulin only in one monomer.
Figure 3
Figure 3. Proposed transduction mechanism
a, Comparison between the cryoEM (insulin bound) and the crystallographic (apo) dimers. Both dimers are shown as surface representation of the coordinates. Similar conformational differences between unbound and insulin bound IR have been observed in Gutman et al.. b, Side and top view of the 4ZXB monomer overlaid onto the cryo EM “open” monomer. The overlay was done using the FnIII-1 domain. c, Schematic diagram of a possible activation mechanism for IR. The IR sub-domains color coded as in Figure 1a (solid color for the α-chain and light colors/thicker outer lines for the β-chain); the inter-monomer disulfide bonds are shown as dotted lines, the “signaling bridge” as solid orange line. Binding of one insulin molecule to the apo receptor (left to middle panel) causes the L1-CR-L2 subdomains of one monomer, the FnIII-1 subdomain of the other and the α-CT helix to move to generate the binding site. The motion of the α-CT helix and the attached ID-α causes, through the “signaling bridge”, a conformational change in the FnIII-3 domain. Since the two ID-α regions are also disulfide bonded, the motion of one is likely to be transmitted to the other, inducing a similar conformational change in the other FnIII-3 domain. These changes propagate through the transmembrane helix to the TK domains, inducing autophosphorylation and activation of the signaling pathway. This state is seen in the cryo-EM Class 2 map. Right: binding of a second insulin molecule recruits the second α-CT (cryo-EM Class1 map) and may fully stabilize the activated complex. Although the diagram suggests that the α-CT helix involved in insulin binding is the one from the same monomer (cis-interaction), there are no currently experimental evidences ruling out a trans-interaction.

References

    1. Saltiel A, Kahn C. Insulin signalling and the regulation of glucose and lipid metabolism. Nature. 2001;414:799–806. - PubMed
    1. Adamo M, Raizada M, LeRoith D. Insulin and insulin-like growth factor receptors in the nervous system. Mol Neurobiol. 1989;3:71–100. - PubMed
    1. Frasca F, et al. The role of insulin receptors and IGF-I receptors in cancer and other diseases. Arch Physiol Biochem. 2008;114:23–37. - PubMed
    1. Craft S. Alzheimer disease: Insulin resistance and AD–extending the translational path. Nat Rev Neurol. 2012;8:360–362. - PubMed
    1. Seino S, Seino M, Nishi S, Bell G. Structure of the human insulin receptor gene and characterization of its promoter. Proc Natl Acad Sci U S A. 1989;86:114–118. - PMC - PubMed

Publication types